
What’s the Matter?
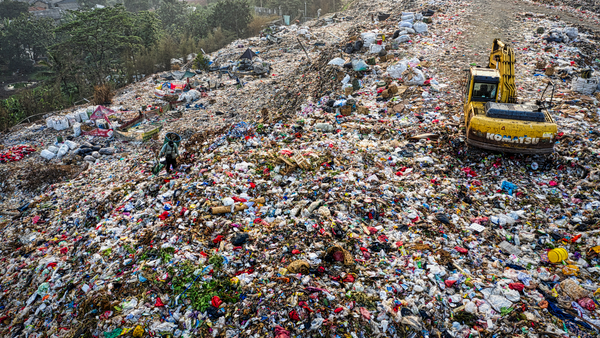
According to the FAO (Food and Agricultural Organization), food security can be achieved when everyone has sufficient and sustainable access to nutritious food. Good food security positively impacts various aspects of life, including community welfare. Among the different aspects of food security, food affordability is the main factor. Food crises still occur in various parts of the world, caused by wars and the COVID-19 pandemic, which restricted human movement. Globally, United Nations Development Programme (UNDP) reports show that the second Sustainable Development Goal (SDGs) (Zero Hunger) has not been maximally achieved in addressing hunger issues.
In Indonesia, food security is regulated by Law Number 18 of 2012 concerning Food, which contributes to national Sustainable Development Goals. According to the Global Food Security Index (GFSI) 2022 data from The Economist Group, Indonesia ranks 63rd out of 113 countries, indicating poor food security. The National Food Security Index (IKP) data indicates that Eastern Indonesia is a food-vulnerable area. Currently, the Indonesian government can only produce food security data at the district/city level once a year, while food security characteristics within districts/cities tend to be heterogeneous, making sub-district level data highly needed.
Although there is food security data at the sub-district level, the precision of this data is still low, as indicated by the high (Relative Standard Error) RSE value. A new framework has been proposed to improve data precision at the sub-district level by utilizing the Small Area Estimation (SAE) model. The implementation of geospatial big data also provides additional benefits in the form of spatial information and faster data updates compared to the current government data.
Alternative: A New Proposed Framework
A new framework has been proposed to enhance the precision of Indonesia's government food security data, particularly concerning food affordability. The sub-district level data on food affordability in East Nusa Tenggara Province for the year 2022 was used to implement this proposed framework. This data suffers from low precision and includes several non-sample areas, resulting in some sub-districts lacking estimation values. Therefore, in addition to working to improve data precision using the Small Area Estimation (SAE) model, this framework is capable of generating estimates by leveraging information from auxiliary variables.
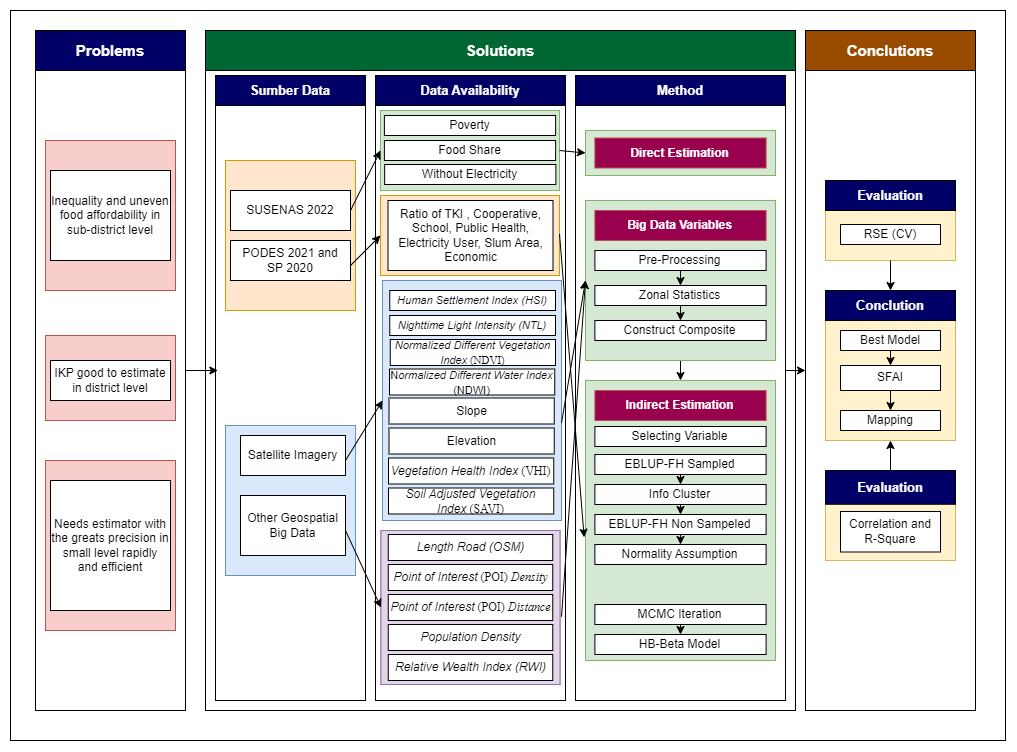
In general, food affordability in Indonesia is measured using three dimensions: economic, social, and physical. The economic dimension is represented by the percentage of poverty, the social dimension by the percentage of households with a food share exceeding 65%, and the physical dimension by access to electricity. For each dimension, an SAE (Small Area Estimation) model will be developed using auxiliary variables derived from big geospatial data.
The innovation in this research lies in the implementation of composite formation proposed as a big geospatial data variable. The composite is created using three composite scenarios and four transformation scenarios. The three composite scenarios include the Weighted Sum Model method with Eigen Value as the weight, Geometric mean, and Arithmetic mean. Meanwhile, the four proposed transformation scenarios are min-max transformation, logarithmic transformation, Yeo-Johnson transformation, and untransformed data.
The best composite for each dimension will be selected using the All Possible Regression method, considering the R-square and AIC (Akaike Information Criterion) values from all twelve scenarios.
Two SAE models have been proposed to identify the best model: the Empirical Best Linear Unbiased Prediction (EBLUP) model and the Hierarchical Bayes Beta (HB-Beta) model. Auxiliary variables from the Village Potential data (PODES) and the population census (SP) are used as benchmarks against the composite big data dataset.
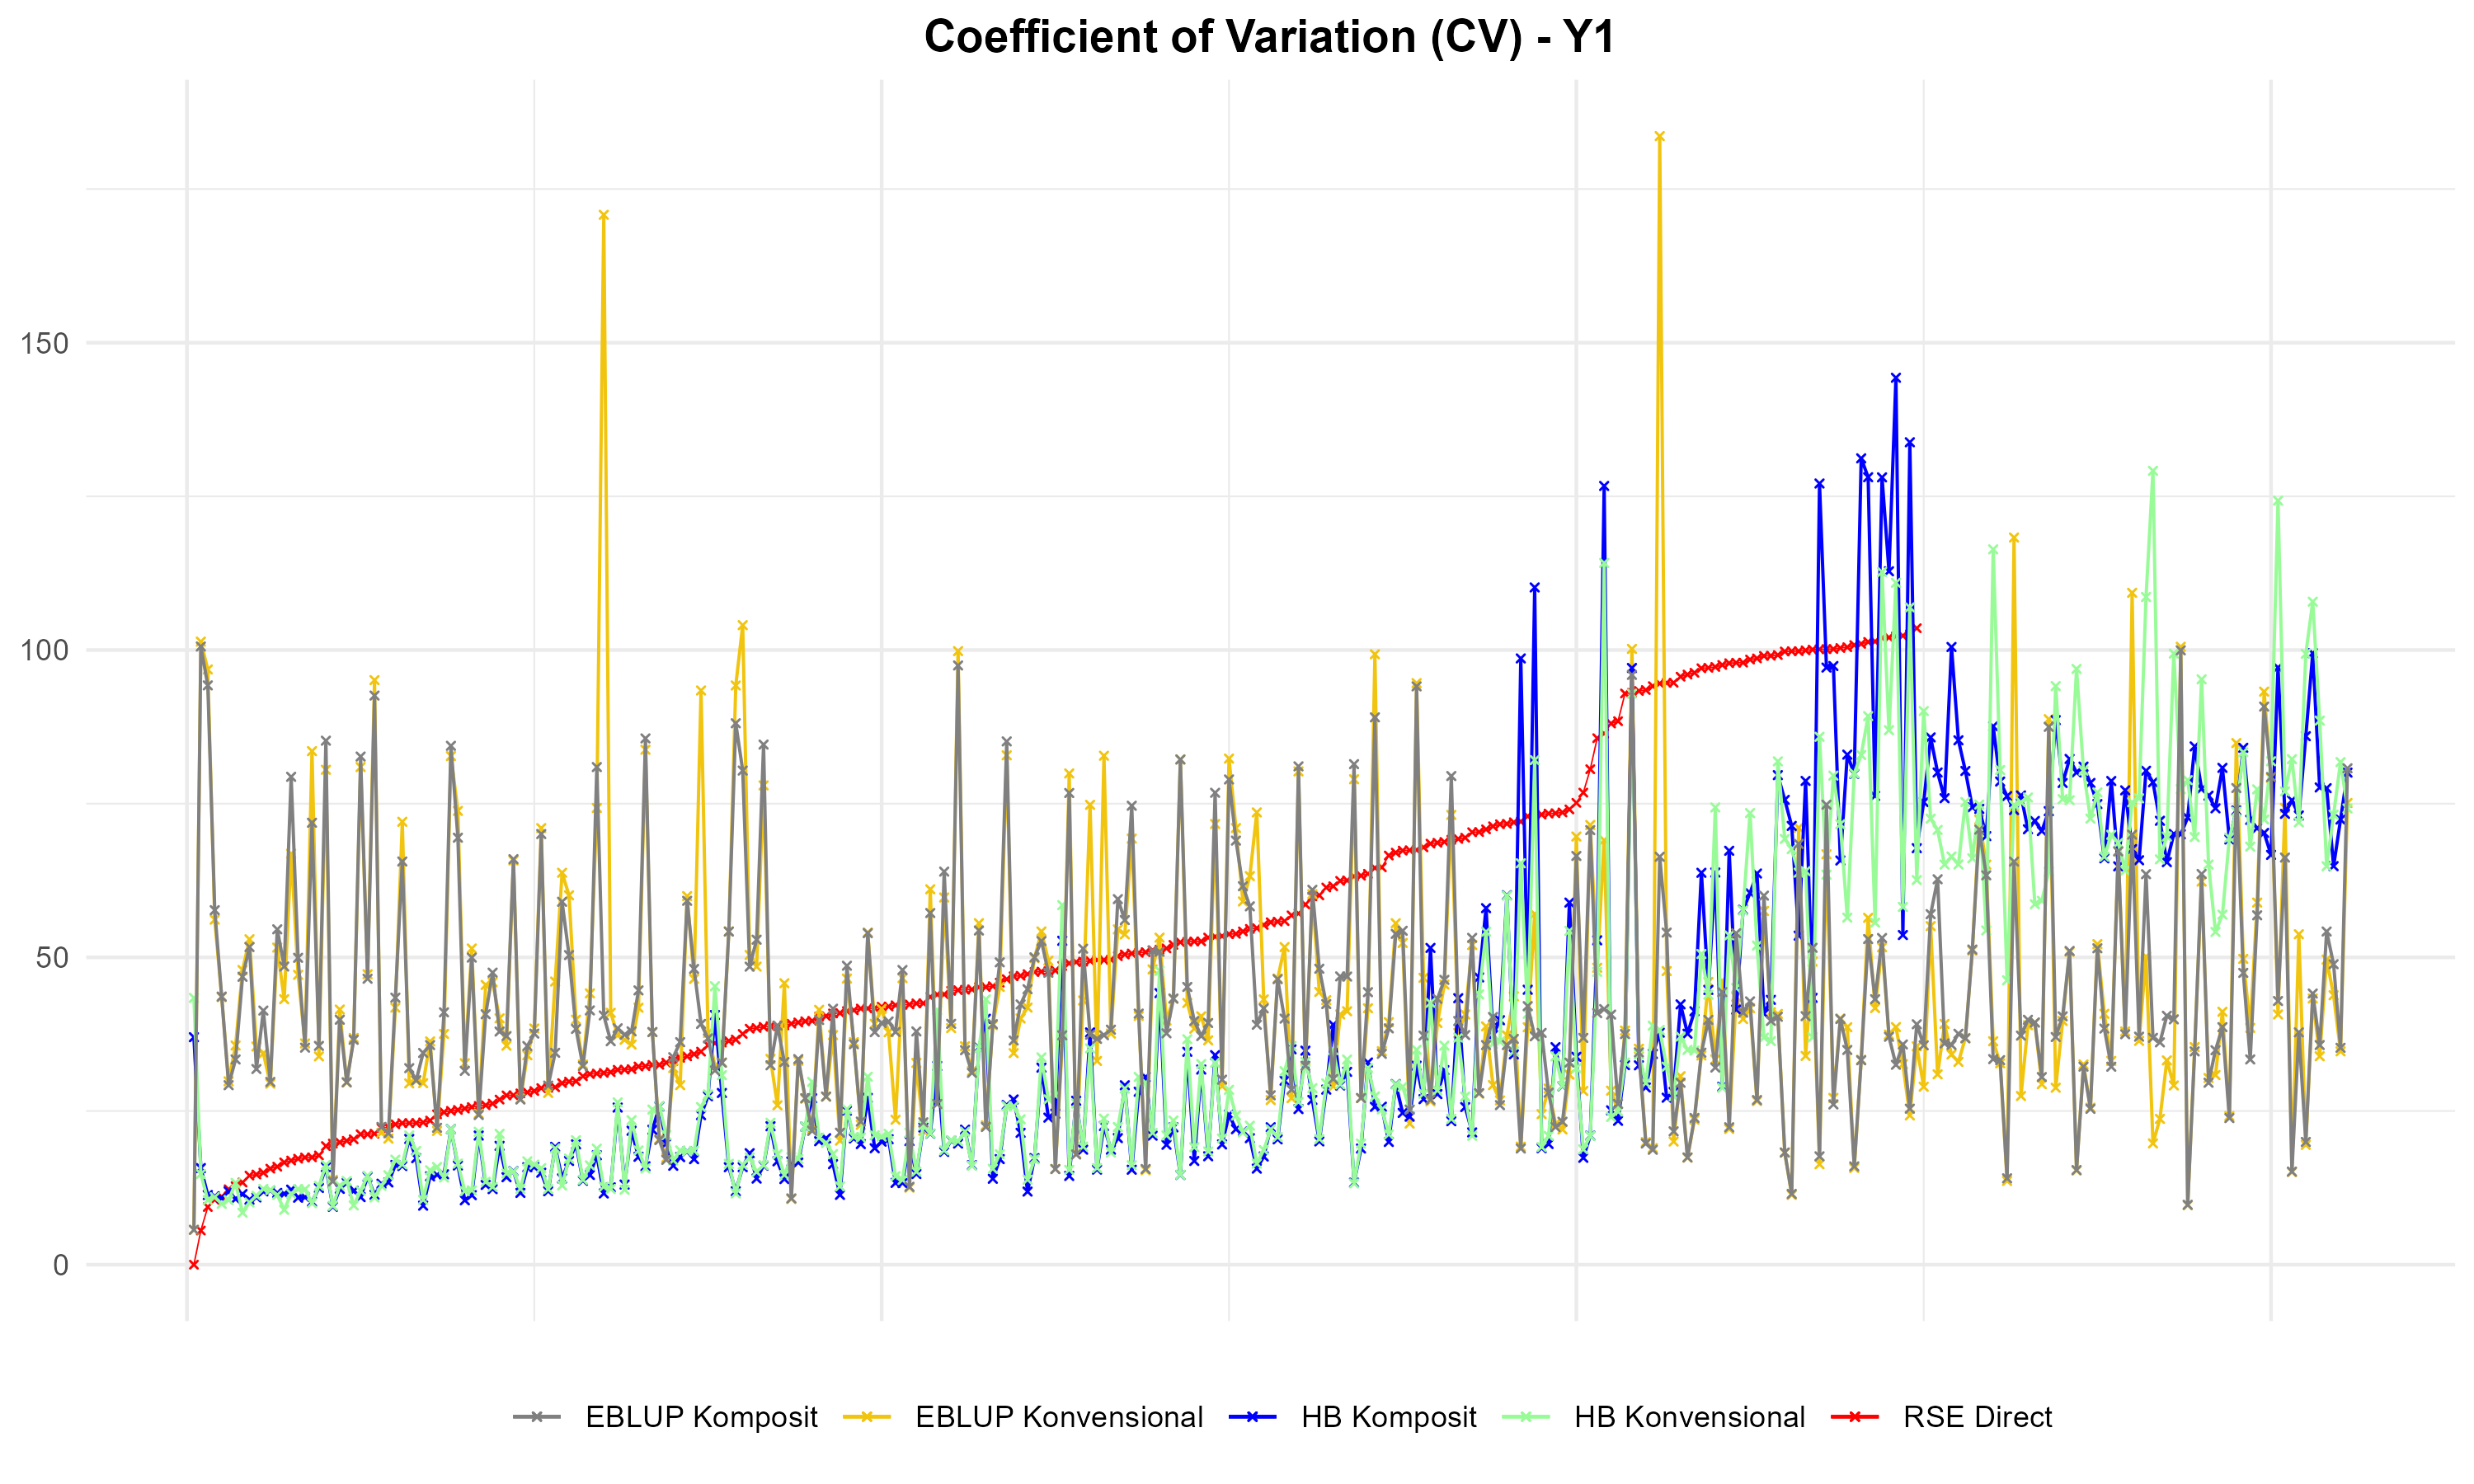
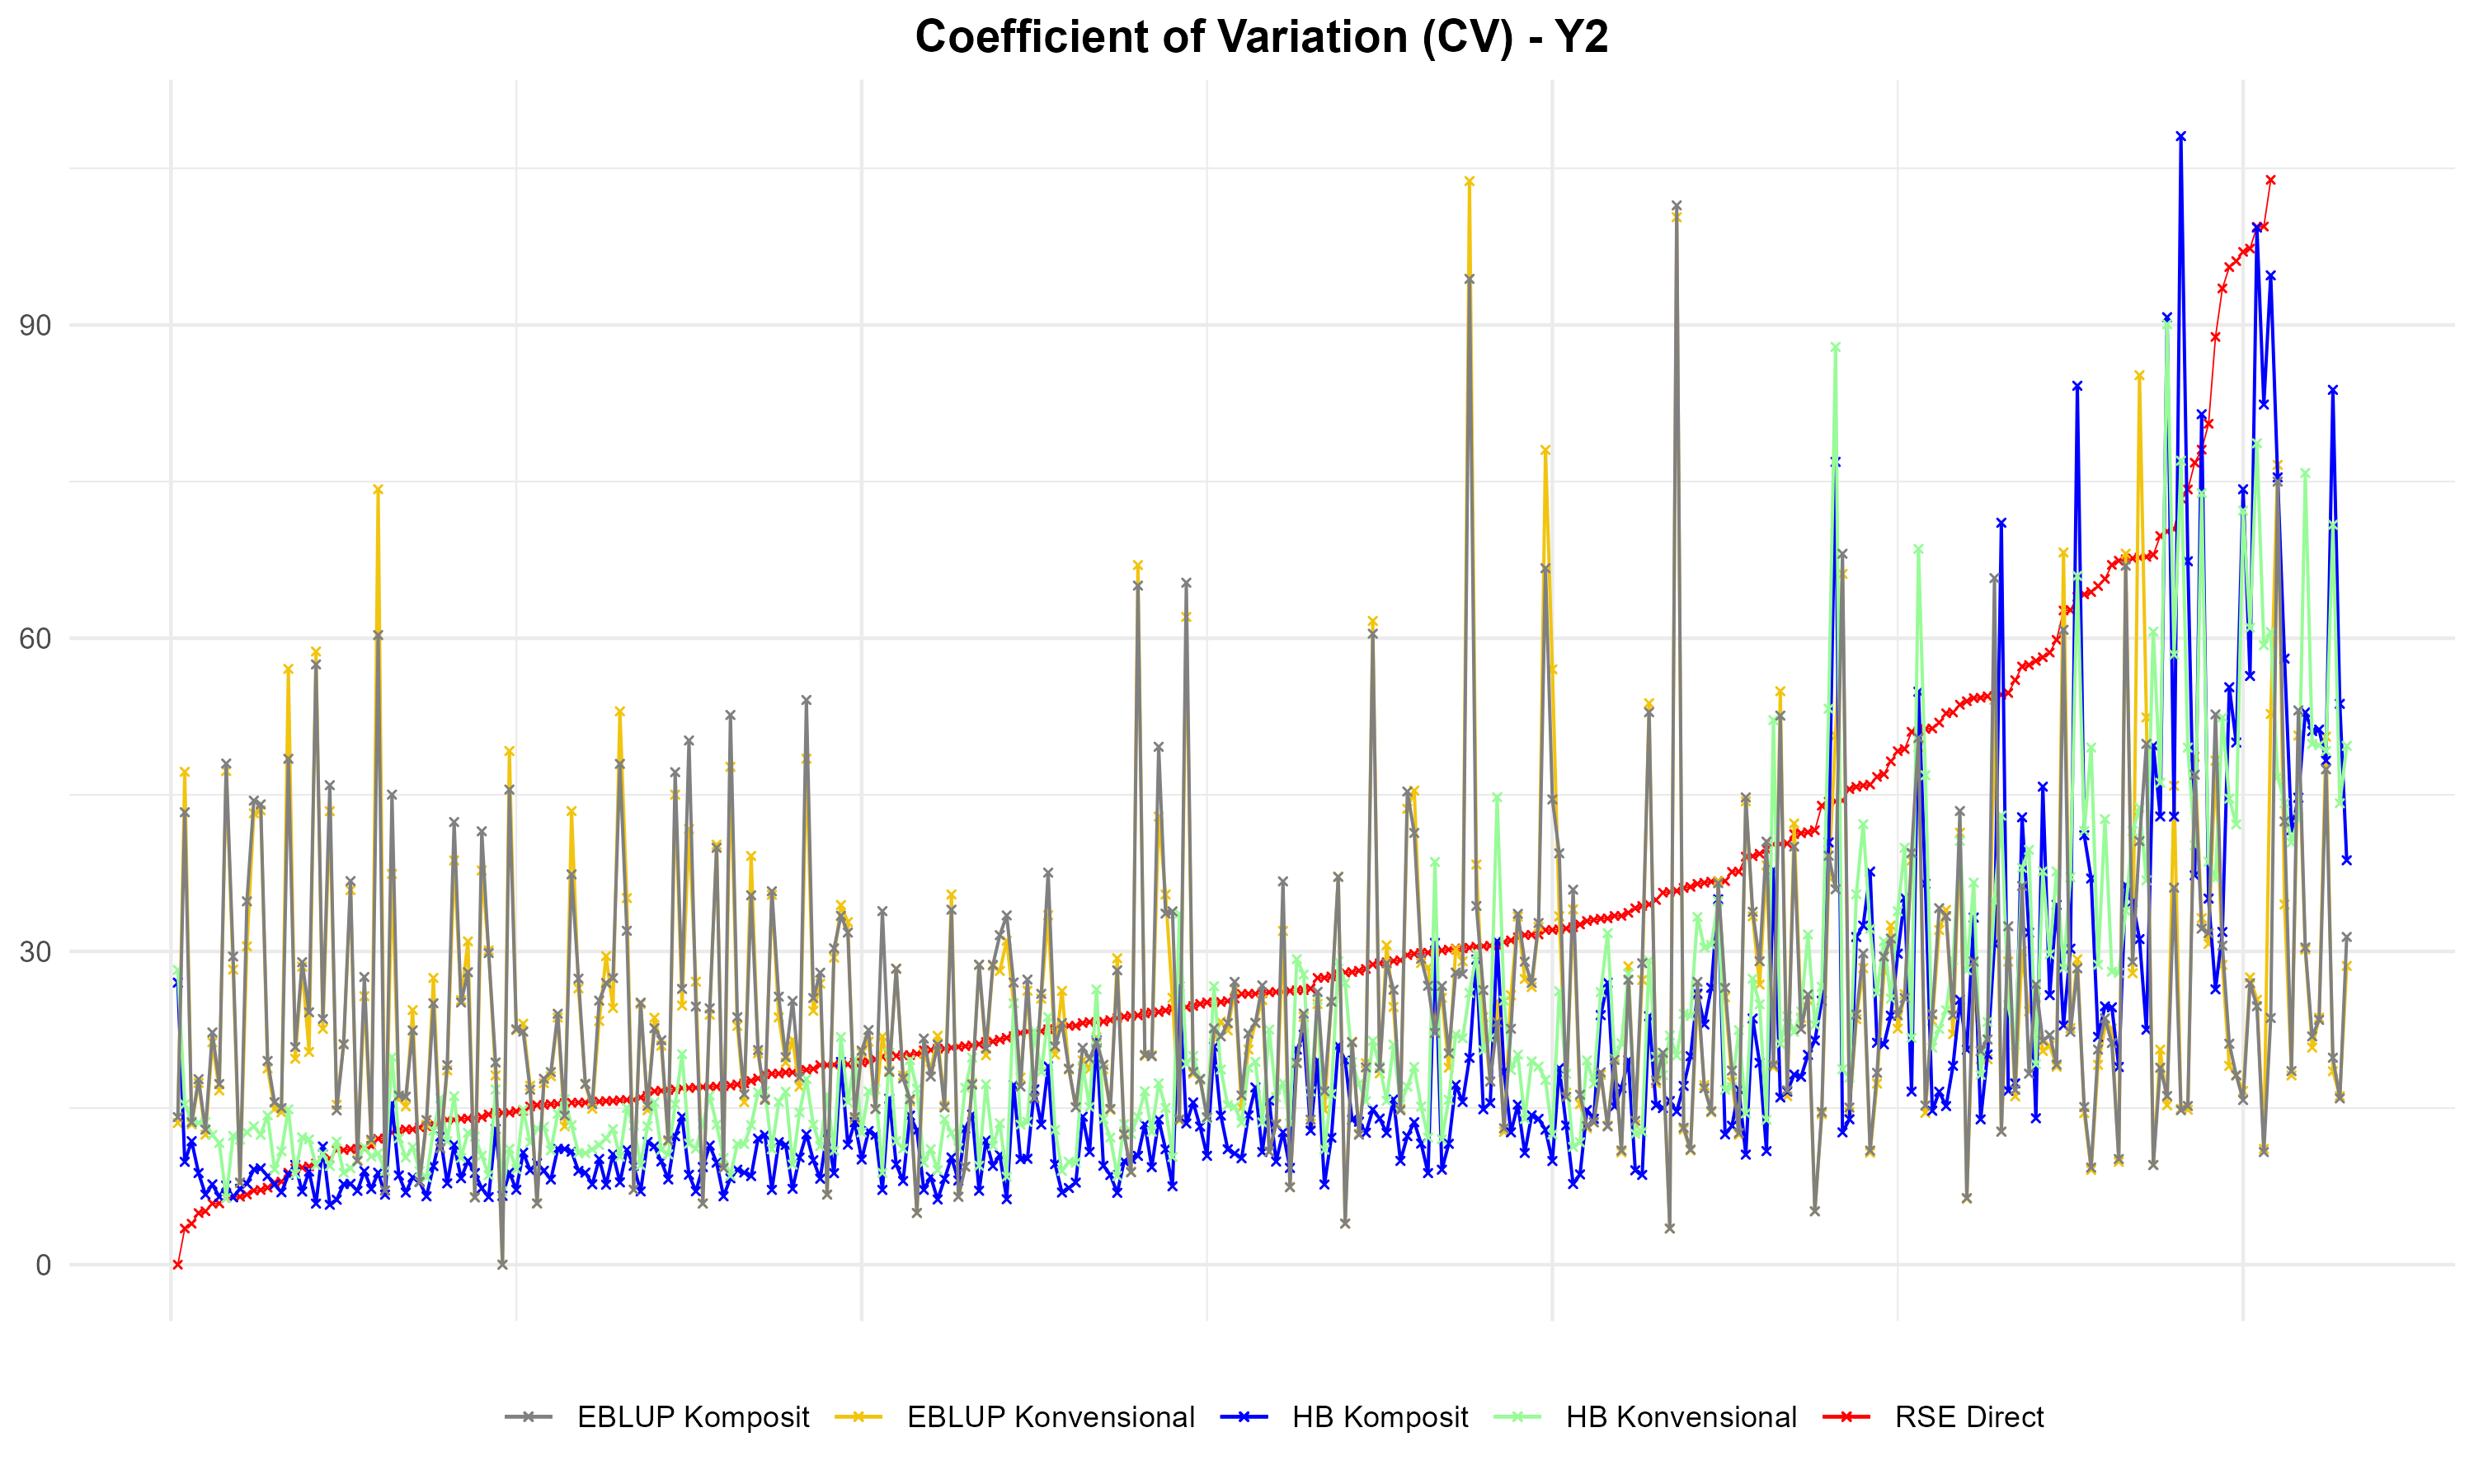
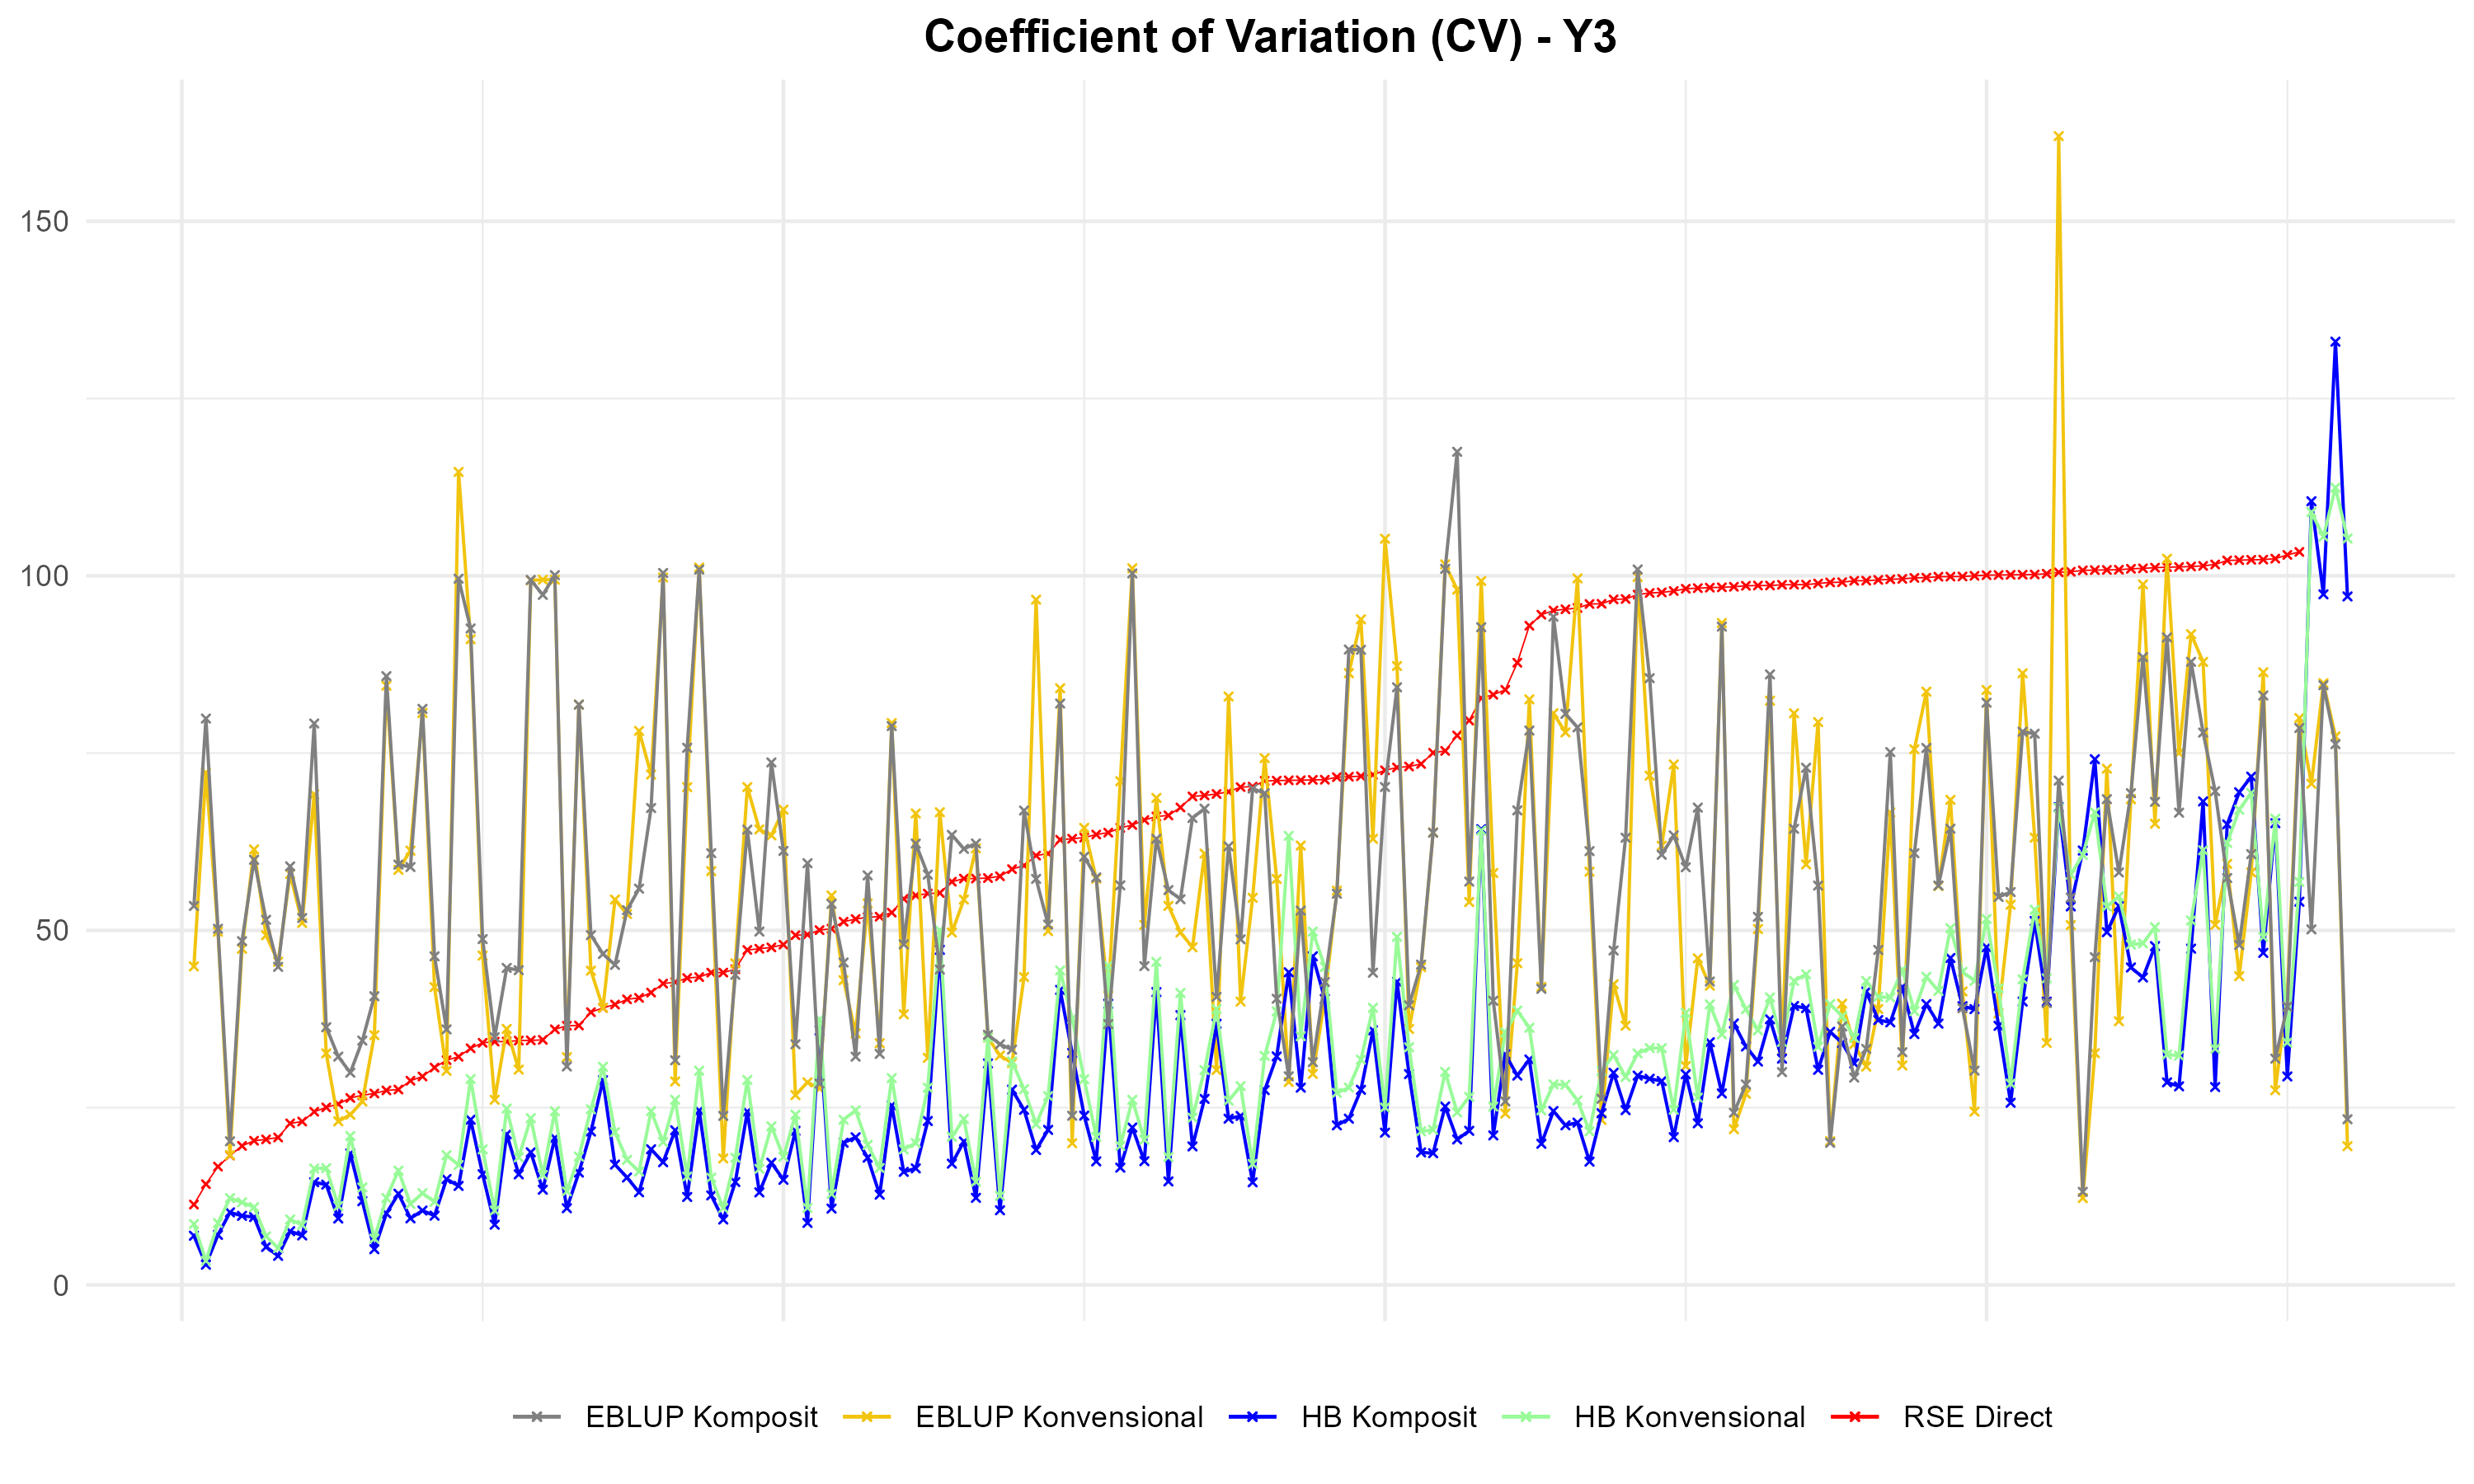
The results indicate that the HB-Beta model, using composite big geospatial data auxiliary variables, has a lower RSE (or Coefficien of Variation, CV) compared to direct estimation datasets and other models. This means that the precision of the HB-Beta model's estimation results is significantly better than that of the other models, indicating much smaller variation in estimator errors (better accuracy). The performance of the HB-Beta model is indicated by the blue line being below the other lines.
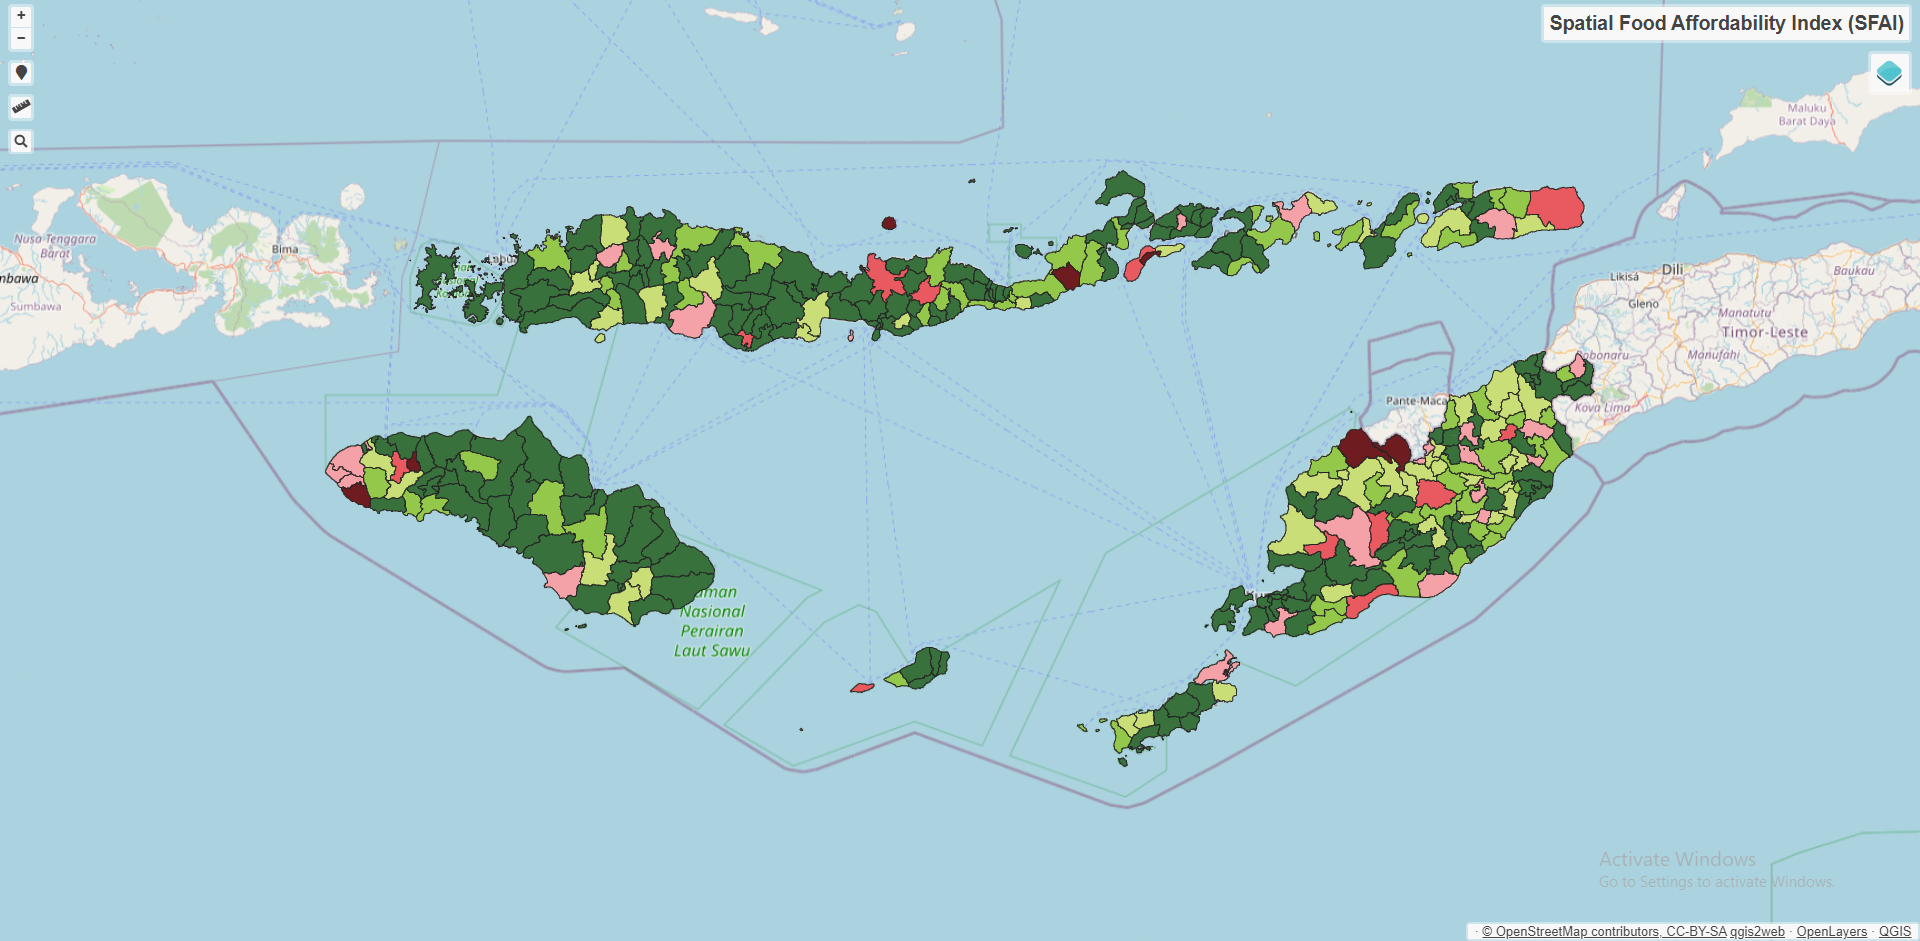
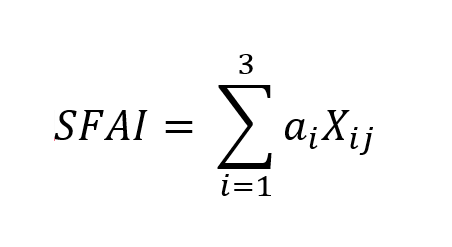
Based on the best model results for each dimension, the Spatial Food Affordability Index (SFAI) was formulated. The distribution of SFAI values in East Nusa Tenggara (NTT) Province is relatively good overall, but some areas are highly vulnerable, such as Mutis, Kodi Balaghar, Waiblama, Solor Selatan, Wewewa Utara, Palue, and Amofang Timur sub-districts. The average SFAI value in NTT is 74.55%, indicating a relatively high level of spatial food affordability.
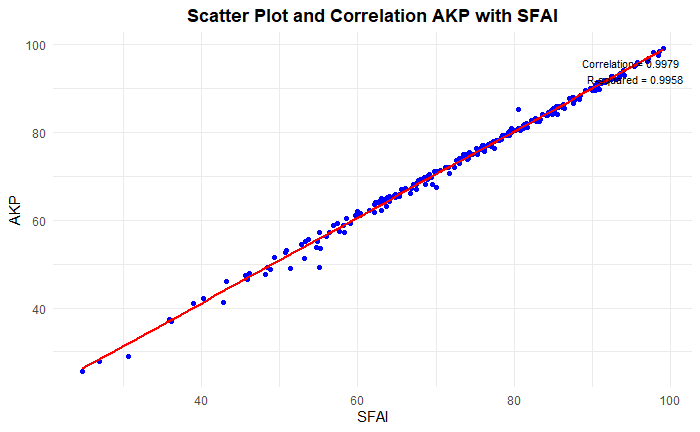
For validation and evaluation, official data was used as a benchmark. The available official data at the sub-district level comprises indicators from the National Socioeconomic Survey (Susenas) related to food affordability. Pearson correlation tests were employed to examine the relationship and pattern between SFAI and the Food Affordability Aspect (AKP). As shown in figure below, there is a very strong correlation (0.9979) between SFAI and AKP at the sub-district level. The R-Squared value of 0.9958 indicates that 99.58% of the AKP can be explained by the SFAI.
Pros and Cons
The Spatial Food Affordability Index (SFAI) has several advantages:
1. High Precision: Using the Small Area Estimation (SAE) model, the SFAI demonstrates a relatively low Coefficient of Variation (CV) compared to direct estimates from official statistics, indicating lower error variation and higher precision without direct surveys.
2. Estimation for Non-sample Areas: SAE models can estimate values for non-sampled areas by leveraging information from surrounding regions and auxiliary variables.
3. Flexibility with Geospatial Big Data: Combining satellite imagery and other geospatial big data offers cost-effective, rapid, and extensive data accessibility, allowing for periodic and economical high-precision modelling.
4. Effective Use of Composites: Utilizing composites as auxiliary variables reduces the complexity of satellite and geospatial data, minimizing anomalies through dimensionality reduction.
However, integrating geospatial big data with SAE models requires expertise in big data processing and modelling, making it challenging for non-experts. Additionally, the estimated beta coefficients (????̂) from the model cannot be reused for future estimates or different regions, necessitating periodic re-modelling. This research contributes a framework for using geospatial big data in SAE models to achieve high-precision sub-district-level food affordability estimates more efficiently than direct surveys.
Conclusion
From the explanation above, it can be concluded that the proposed framework has successfully enhanced the precision of sub-district-level food affordability spatial based (SFAI) in East Nusa Tenggara Province. This improvement is indicated by the low Relative Standard Error (RSE) in the estimation results using the framework compared to direct estimation. The effectiveness of the SFAI is further supported by the estimation results being similar to direct estimates but with significantly better precision. Additionally, this framework can optimally update spatially-based food affordability data continuously, adapting to the availability of geospatial big data such as satellite imagery.