
Why is Human Development Index Data so Important and Strategic?
The Sustainable Development Goals (SDGs) are a global action plan developed by the United Nations (UN) to end poverty, protect the planet, and ensure that all people enjoy justice and prosperity (United Nations, 2015).
In today's modern world, quality of life and development lead to the improvement of human living standards and well-being as well (Sen, 1999). The importance of good human development means that everyone should have an equal opportunity to achieve this well-being (Haq, 1995). This is because the goal of human development is to create a society that has a long life, lives a healthy life, and leads a productive life in an equitable and sustainable manner (Statistics Indonesia -Badan Pusat Statistik, 2022). Thus, economic growth and progress are not the only way to measure the success of human development; the improvement of the quality and standard of living of the community is also an important indicator.
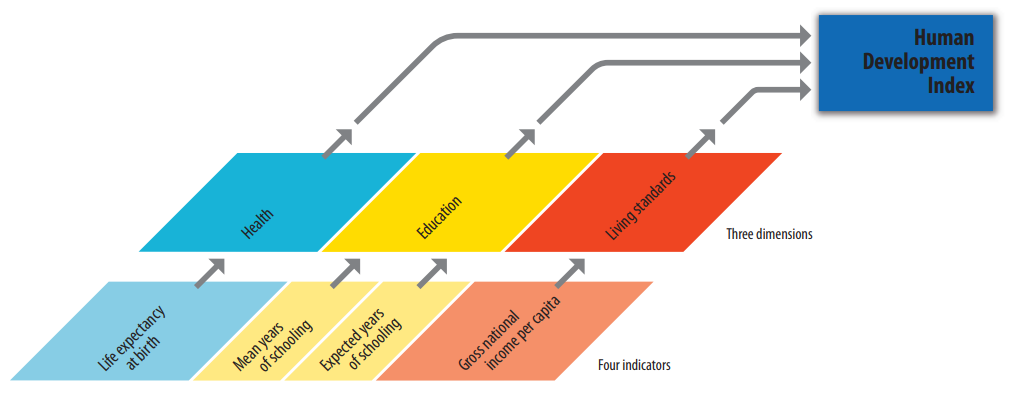
The quality of life and human development are measured by the Human Development Index (HDI), introduced by the United Nations Development Programme (UNDP) in 1990. The HDI is based on three dimensions: a long and healthy life, measured by Life Expectancy at Birth (LE); education, represented by Expected Years of Schooling (EYS) and Mean Years of Schooling (MYS); and a decent standard of living, assessed through gross national income per capita (In Indonesia is using adjusted real per capita expenditure) (Statistics Indonesia-Badan Pusat Statistik, 2023).
Those indicators align with the SDGs on health and well-being (Goal 3), quality education (Goal 4), and inclusive economic growth (Goal 8) (United Nations, 2016). HDI is crucial for evaluating human development and ranking regions or countries. In Indonesia, it is a strategic measure of government performance and is used to determine the General Allocation Fund (DAU) (Statistics Indonesia - Badan Pusat Statistik, 2022).
The Condition of HDI Achievement in Indonesia
In 2022, the HDI in Indonesia was 72.91 (Statistics Indonesia-Badan Pusat Statistik, 2023). On the other hand, the government targets the HDI in Indonesia to reach 75.54 in order to achieve equitable development and quality of human life in the Medium-Term Development Plan (RPJMN) target (The Ministry of National Development Planning, 2019). However, the level of official HDI data presentation in Indonesia is limited to the regency or municipality level, with updates once a year. In addition, the dominant source of HDI data collection comes from the conventional method, the National Socio-Economic Survey (SUSENAS), which requires much greater effort, cost, and time. Achieving this target requires granular data presentation and faster updates to assist in the monitoring and evaluation process of comprehensive human development planning, so an alternative method of presenting HDI data is needed.
Our Innovation: Combination of Geospatial Big Data and Machine Learning Algorithm
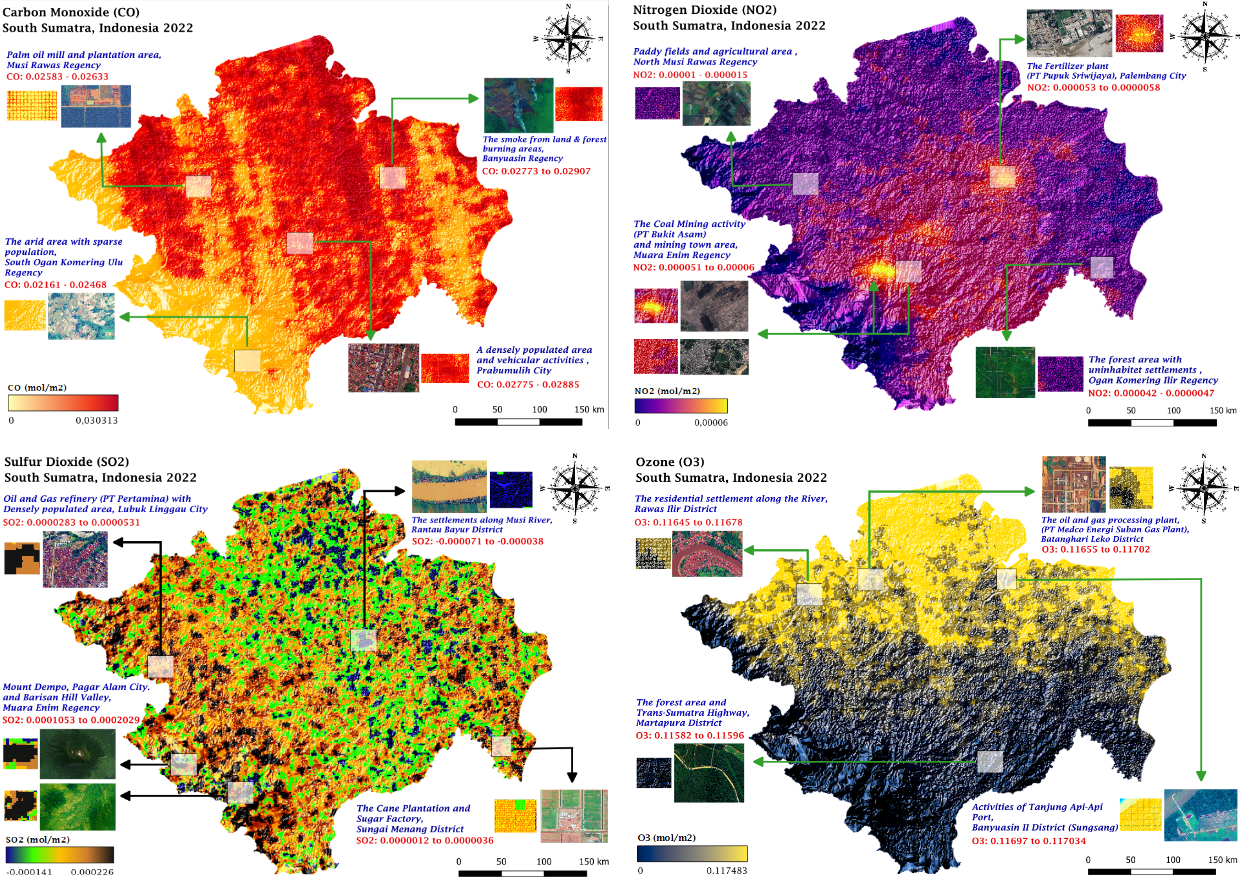
The use of geospatial big data, such as remote sensing satellite imagery and points of interest (POIs), have the potential to overcome the limitations of official HDI data. Remote sensing is a method for collecting information about the surface of the Earth through electromagnetic radiation produced by a device that is not in direct contact with the object (Statistics Indonesia-Badan Pusat Statistik, 2022). One of the products of remote sensing is sensor capture from satellite imagery such as Suomi-NPP VIIRS, Sentinel 2 Multi Spectral Instrument (MSI) Level 2A, Sentinel-5 Precursor, Terra-MODIS, and NASA SRTM spacecraft.
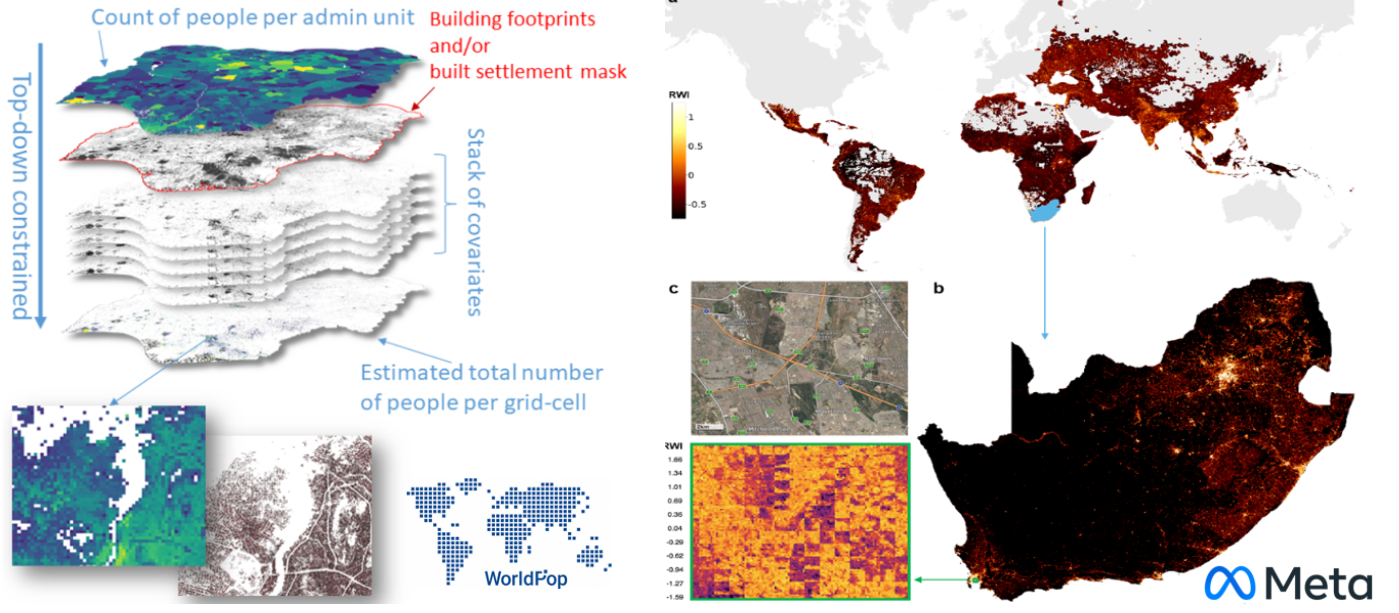
Additionally, POIs are geospatial datasets that contain information about location points on the Earth's surface (Liu & Xiong, 2013). Some other geospatial big data products are WorldPop's Gridded Population and Meta Facebook's Relative Wealth Index (Chi et al., 2022), which provide detailed data coverage. Some of the advantages of collecting data with this technique are: provide more accurate data or correspond to the true state of the population; objectively and effectively observe socio-economic and physical phenomena; lower costs; and provide a more granular representation of their territory (Putri et al., 2022; Ramadhan & Wijayanto, 2023; Utami et al., 2023). Then, by combining use of those geospatial big data with machine learning algorithms, it is possible to extract granular mappings of the quality of life and well-being indicators to estimate the HDI.
The Data and Variables Proposed
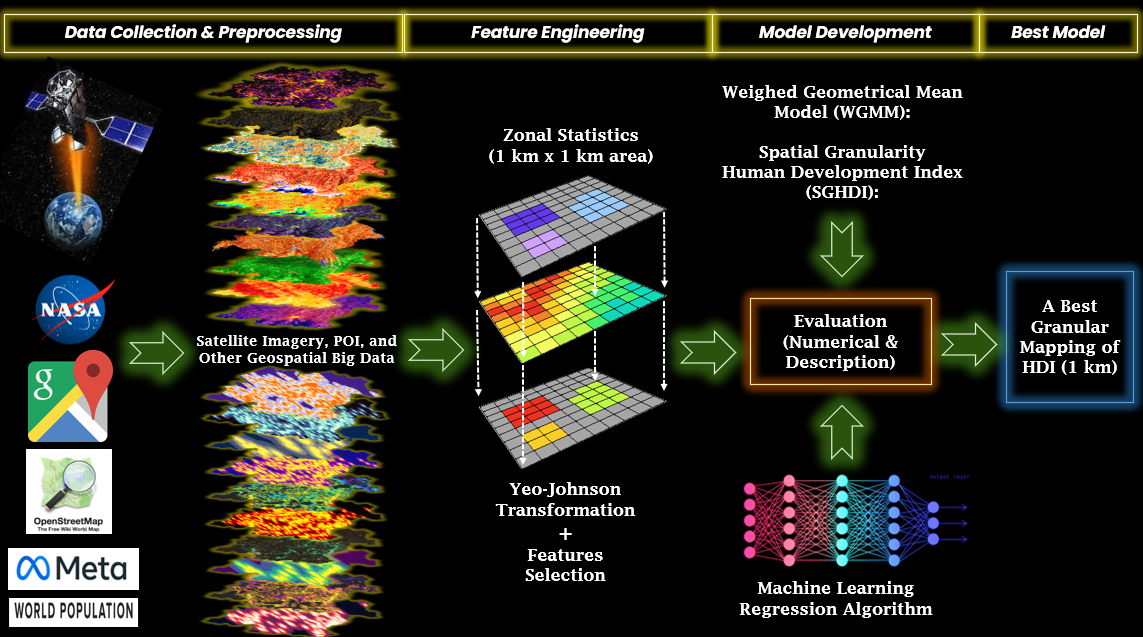
The satellite imagery from many sensors, POIs, and other geospatial big data sources are some of the sources of the data used. The satellite image data was collected between January 1, 2022, and December 31, 2022, with a locus in South Sumatra Province. The road network map data was sourced from OpenStreetMap, while the POIs data were obtained from Google Maps.
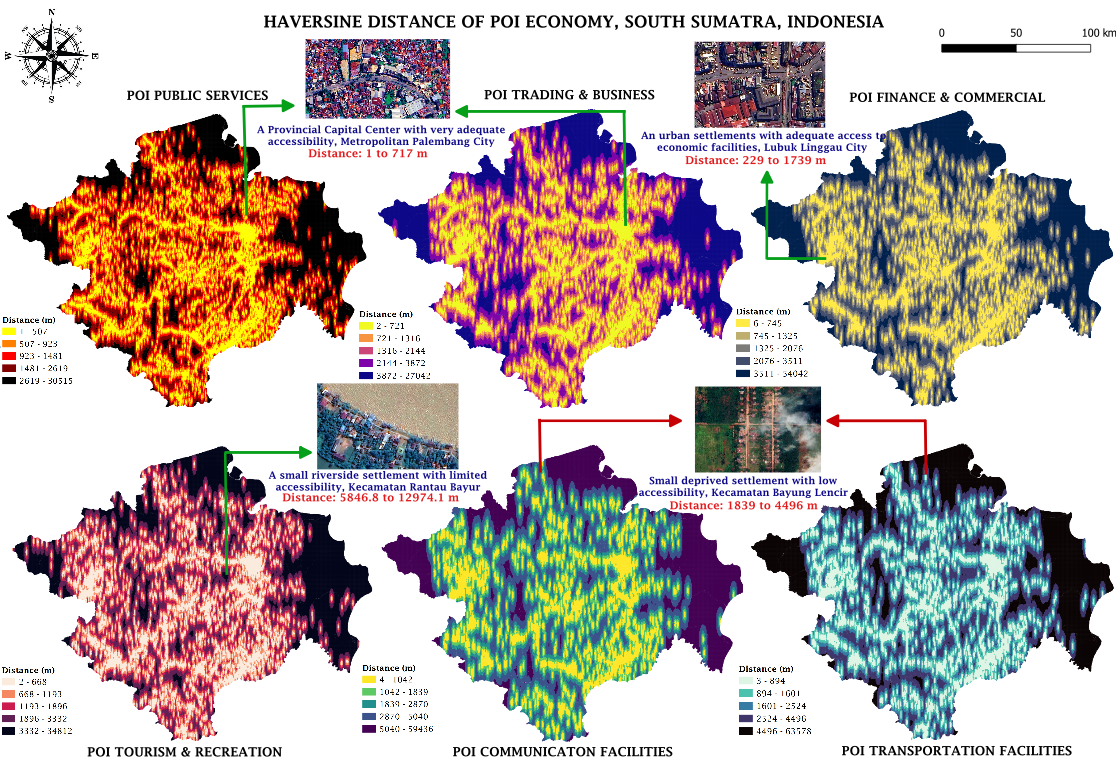
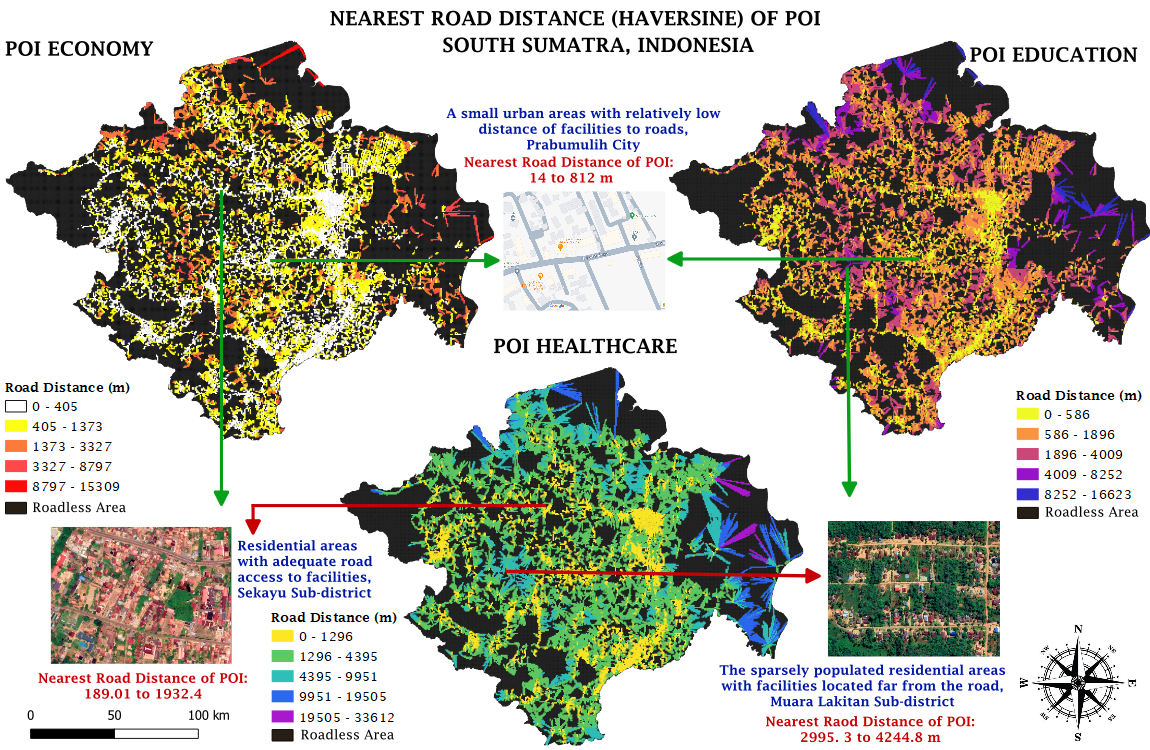
The crawled POIs data is a total of 92,371 points grouped by the categories of health, education, and economic facilities. A total of 7,707 are educational facilities consisting of Primary School (4,831), Junior High School (1,254), Senior High School (1,188), and Univerity/College (434). Meanwhile, there are 4,809 health facilities consisting of hospitals (154), Community Health Center (1,124), Clinic/Medical Centre/Doctor (1.797), and Pharmacies/Drug Store (1,014). The largest number is economic facilities, which is 80,575 consisting of Public Services (28,355), Trade & Business (18,460), Finance and Commercial (12,258), Recreation & Tourism (9,265), Transportation (6,702), and Communication (5,535). We then counted the number of such facilities within each 1-kilometer resolution area to illustrate infrastructure density, and calculated the distance of each central 1-kilometer resolution area to the nearest facility using haversine distance to illustrate accessibility. To measure an infrastructure's connection to the transport system we also calculated the distance of each facility to its nearest road network from OpenStreetMap using the same Haversine distance.
The Relative Wealth Index (RWI), High Resolution Population Density (derived from Meta Facebook), and Gridded Population (supplied from WorldPop) are other geospatial big data sources that are utilized. The official statistics data from the 2021 Village Potential Data (PODES) recording and the overall population were then obtained from Statistics Indonesia (BPS) as a supplementary dataset. In order to estimate indicators on the HDI, each data used is categorized into aspects.


Our Methodology Framework
The feature extraction results of geospatial big data variables that have been feature engineered will become independent variables in each machine learning model. In addition, the Spatial Granularity Human Development Index (SGHDI) is also developed for HDI mapping through the approach of each indicator. The final result of both is HDI mapping at the best granularity level of 1 km x 1 km spatial resolution.
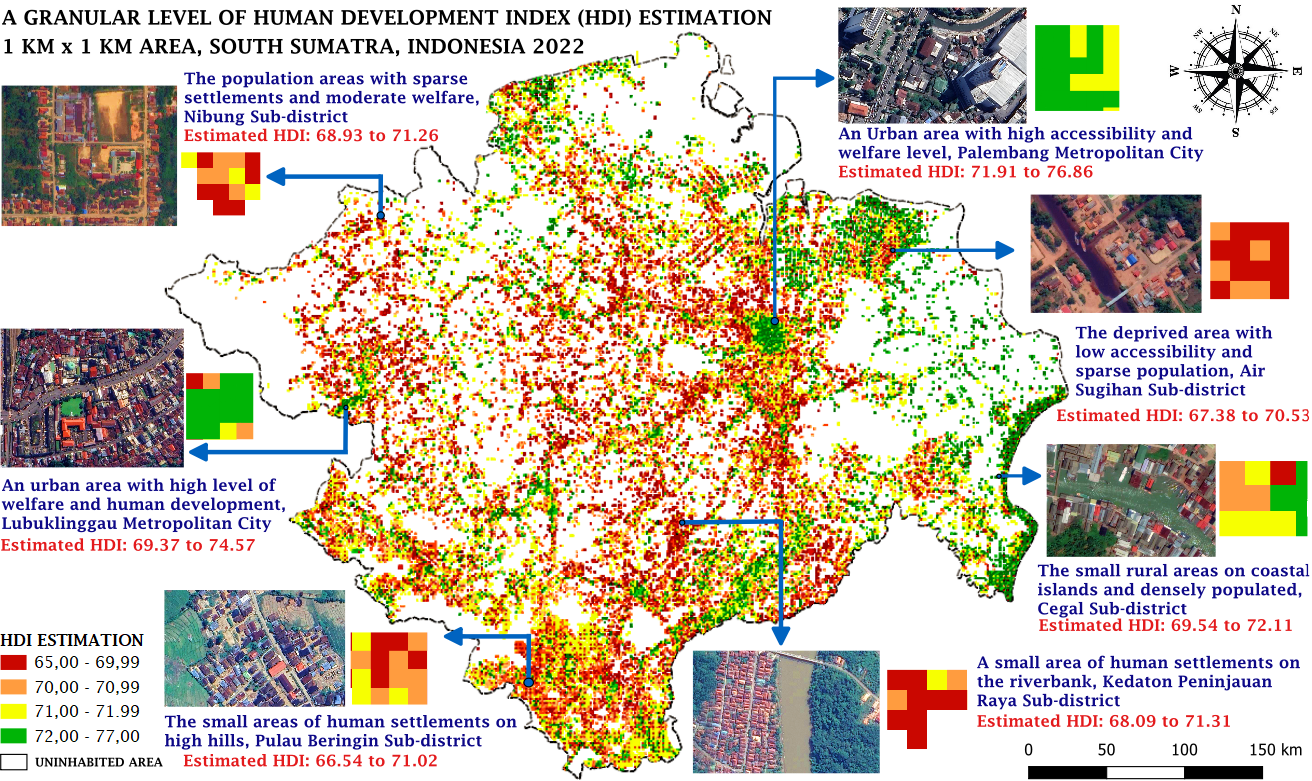
The Spatial Granularity Mapping of Human Development Index with High Resolution
In order to map the human development index, spatial granular estimation is essential for both identifying areas with higher concentrations of deprivation and offering a comprehensive understanding of the index's distribution. A finer-grained assessment of human development can be obtained by applying sophisticated spatial analytic tools.
This case study estimates South Sumatra of the human development levels using a variety of data sources. Environmental factors, socioeconomic indicators, demographic data, geographical datasets, and other pertinent local data are some of these data sources to each dimensions. Spatial modeling approaches can be used to estimate human development throughout the province by combining and analyzing this data.
Within South Sumatra Province, a more precise and targeted calculation of the human development index is possible because to the spatial resolution of a 1-kilometer area. It makes it possible to identify groups and regions that are more susceptible to poor development, which makes it easier to establish tailored interventions and policies to address the particular difficulties that people in such areas experience.
Spatially explicit data, which can be seen through maps or other graphical representations, are the results of the estimate process. These maps offer insightful information about how the human development index is distributed among the various regions in the South Sumatra Province, which can help stakeholders and policymakers identify areas of concern and put into place practical solutions to reduce development inequality.
Decision-makers can learn more about the localized dynamics of human development in South Sumatra Province by carrying out a case study with a 1-kilometer area resolution. This information can direct the creation of customized plans, initiatives, and regulations aimed at lowering inequality and enhancing the welfare of the populace in the region.
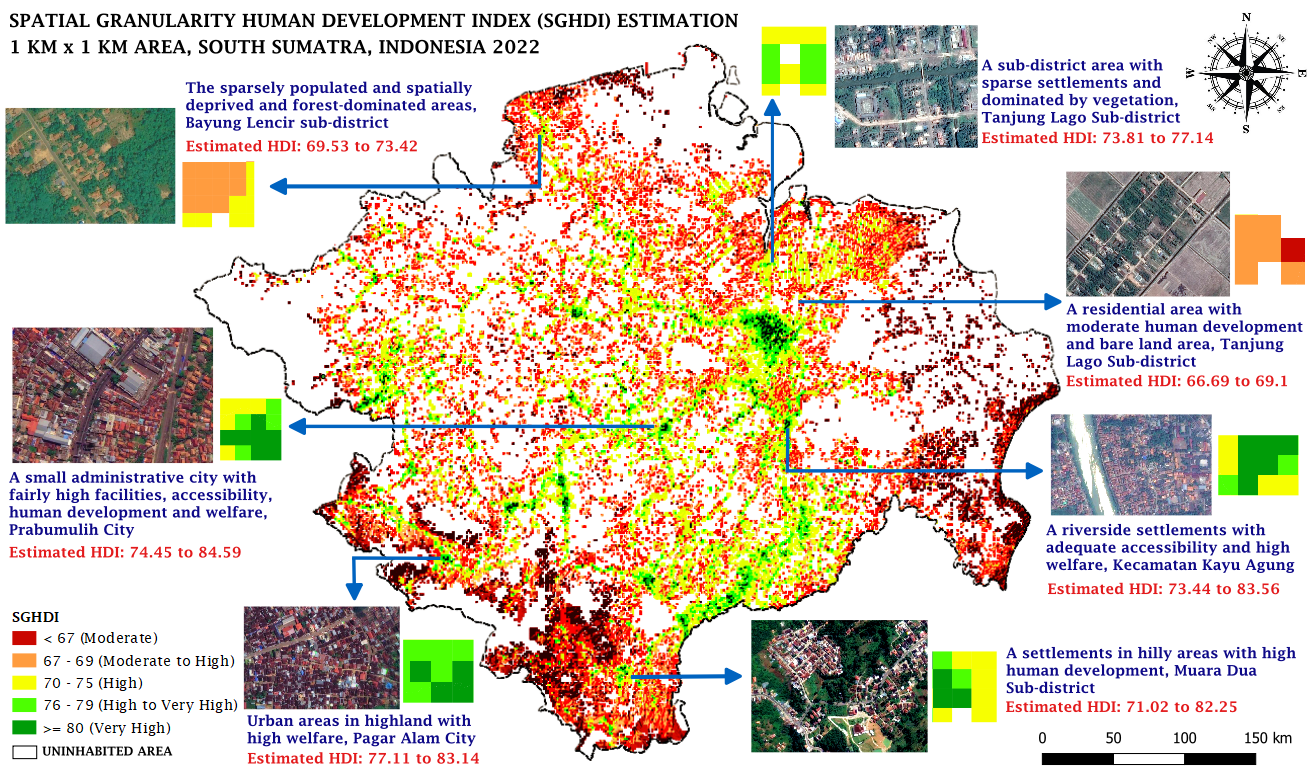
The mapping results of our proposed Spatial Granularity Human Development Index explain 73.8% of the official HDI data at the regency/municipality level and are highly correlated at the indicator level. Mapping with the help of machine learning algorithms is very likely to exceed our SGHDI, which can explain 71.8% of official data at the sub-district level and 85.2% at the regency/municipality and both are very strongly correlated. This proves the advantages of using the combination of geopastial big data and machine learning algorithms that we propose to assist policy making through the provision of quality data.
The 2-dimensional and 3-dimensional map dashboards have the advantage of allowing users to pinpoint specific geographical places within each 1km area. The map dashboard produced in this research includes various additional components that can help stakeholders and users to identify HDI estimates and each of its indicators more accurately, more intuitively, and interactively.
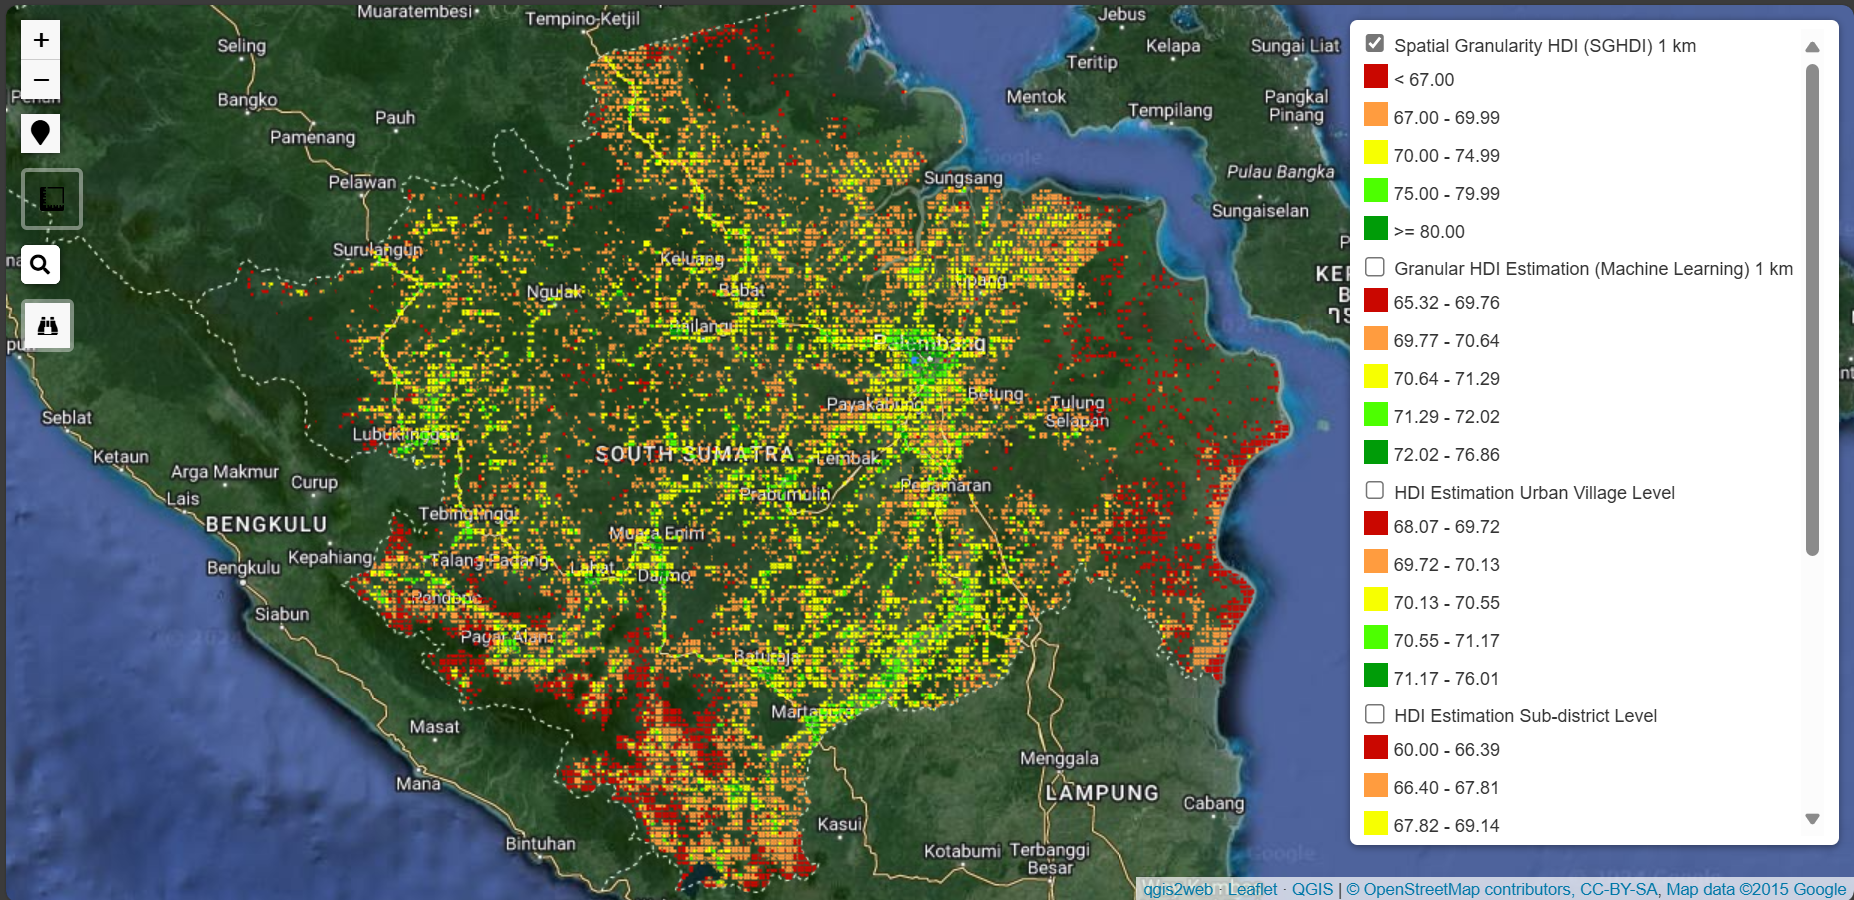
VISIT 2D MAP DASHBOARD HERE!
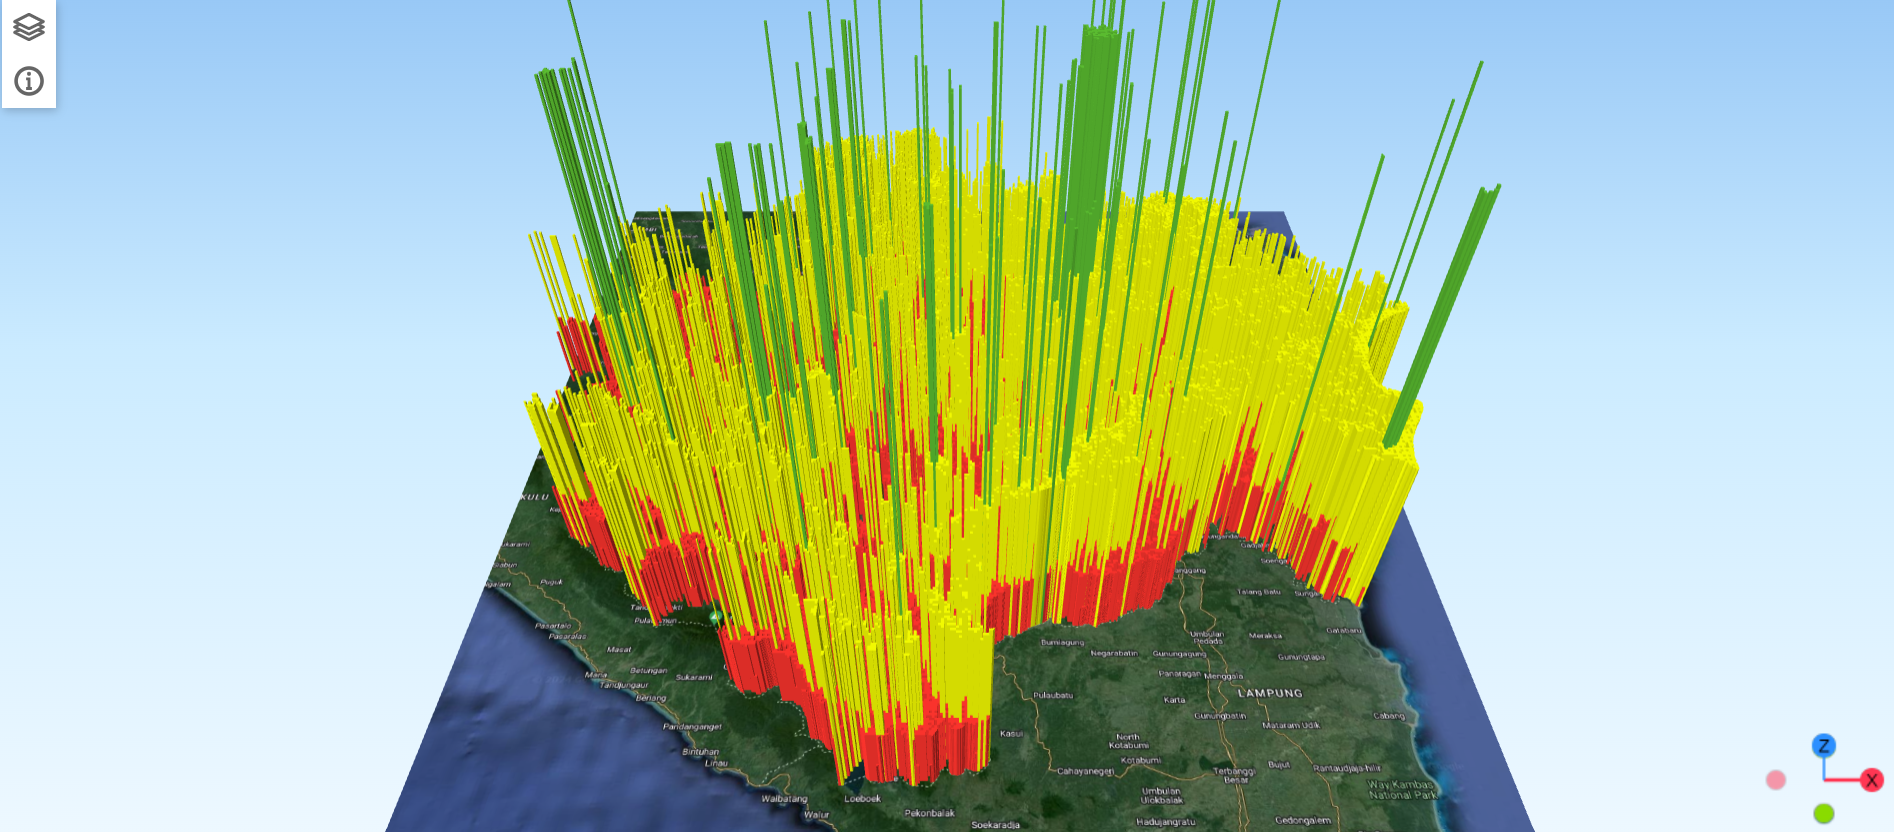
VISIT 3D MAP DASHBOARD HERE!
Human Development Priority Areas
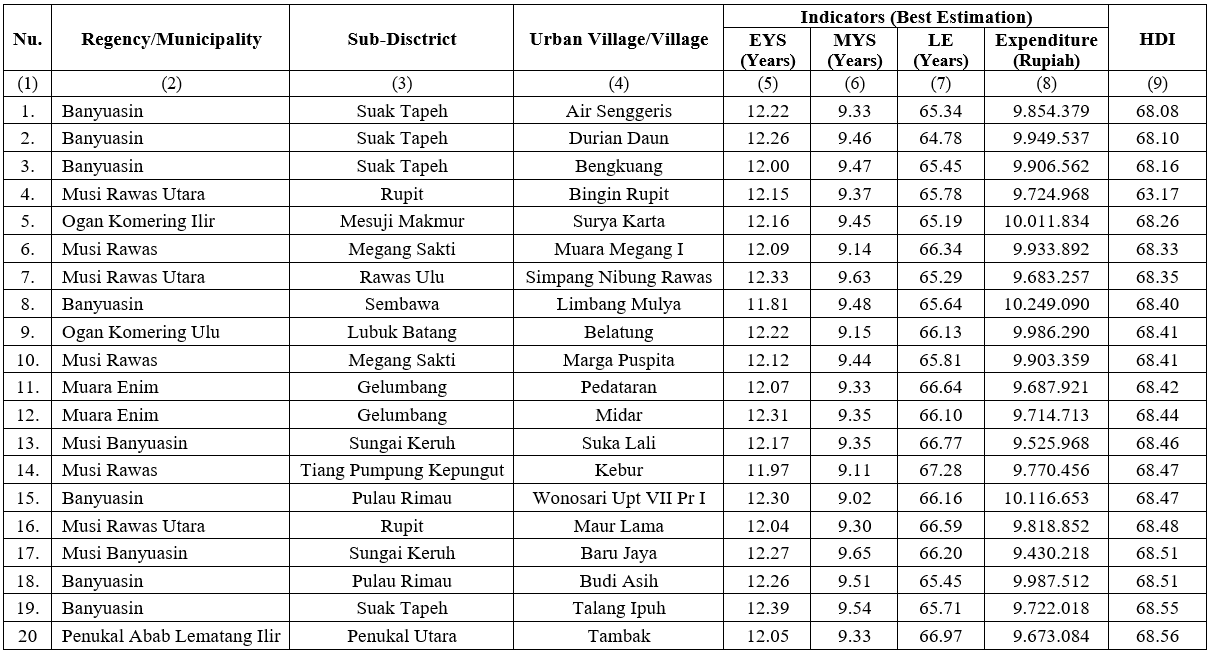
The results of HDI granular mapping estimation at the best 1 km x 1 km level can be used as the basis of priority areas for human development policy direction. The results of the HDI granular estimation at the 1 km level in this study show the advantages of detailed areas that can be covered from the use of geospatial big data, but the direction of development policies is carried out at the smallest level, namely sub-village/village using the distribution of the General Allocation Fund (DAU). The policy evaluation can be identified through the web map dashboard that has been built. HDI estimation figures at the granular level have been aggregated from the village level to the sub-district level on the map dashboard so that it can facilitate stakeholders in determining the policy of development priority areas.
There are many areas with HDI achievements below the national average (national HDI = 72.91), namely 3,119 urban villages/villages, and below the average of South Sumatra Province (South Sumatra HDI = 70.90), namely 2,382 urban villages/villages, based on the results of identifying the estimated HDI figures in 3,264 urban villages/villages through the map dashboard. To increase population welfare and meet the HDI target in the RPJMN IV agenda, these villages must be assessed and closely watched for greater human development in terms of the health, education, and economics of their citizens.