Why is Child Poverty a Crucial Concern?
The world has made remarkable progress in advancing development in recent years. However, the stark reality remains that more than 700 million people still live in extreme poverty (UNICEF, 2020). Among the most vulnerable and affected by this dire situation are children. Growing up in poverty, they often endure inadequate access to food, sanitation, housing, healthcare, and education, hindering their ability to survive and thrive.
UNICEF reports that approximately 1 billion children worldwide are deprived across multiple dimensions, lacking fundamental necessities such as proper nutrition and clean water. Shockingly, around 365 million children live in conditions of extreme poverty (UNICEF, 2020). In other words, over half of the global population enduring extreme poverty comprises children. This aligns with the World Bank's assertion that children face a higher risk of poverty compared to adults, primarily due to poor households tending to have more children than non-poor households (World Bank, 2011).
In the context of Indonesia, a developing nation, child poverty presents a critical challenge. According to data from the Central Statistics Agency in 2017, approximately 40% of Indonesia's impoverished population consists of children (Central Statistics Agency, 2017). Alarming trends reveal that impoverished children in Indonesia often remain trapped in poverty as they reach adulthood (Rizky, Suryadarma, & Suryahadi, 2019). These cycles of poverty perpetuate as the children of impoverished individuals are likely to be born into impoverished households. If left unaddressed, this persistent issue will perpetuate a never-ending cycle of poverty in Indonesia. Hence, it becomes imperative to prioritize the alleviation of child poverty as a means to tackle the larger challenge of sustained poverty in the country.
Child Poverty Alleviation
Child poverty is neither inevitable nor impervious to intervention. As evidenced by numerous countries, it can be mitigated and even eradicated through sustained attention and proactive measures (Edmonds, E. V., & Schady, N., 2012).
The Sustainable Development Goals (SDGs) have united nations in a historic commitment to address extreme child poverty. The SDGs strive to create a world where all children have the necessary resources to survive, thrive, and reach their full potential by reducing multidimensional child poverty by half before 2030, surpassing mere income-based measurements (UNICEF, 2020).
Indonesia, too, has embraced the SDG agenda on child poverty within its National Medium-Term Development Plan (RPJMN) spanning from 2015-2019 to the current period of 2020-2024 (Statistics, 2017). The 2020-2024 RPJMN of Indonesia has set forth comprehensive development targets to tackle child poverty at a macro level.
The Indonesian government has undertaken various initiatives to combat child poverty, including the implementation of programs such as the Program Indonesia Pintar (PIP), Program Keluarga Harapan (PKH), School Operational Assistance (BOS), and other targeted social assistance schemes. However, effective monitoring by policymakers is crucial to ensure the accurate and efficient delivery of poverty alleviation aid to the intended beneficiaries (Fiscal Policy Agency, 2021).
Utilization of Satellite Imagery and Other Geospatial Big Data
Geospatial Big Data refers to a vast collection of data that is geographically referenced. It encompasses a wide range of information that can be leveraged to understand various aspects, including economic activities and accessibility within a specific geographical area.
Satellite imagery is an integral part of geospatial big data, capturing measurements of objects and phenomena on the Earth's surface without physical contact. It provides a comprehensive view of the social and economic conditions in a given region, offering objective insights based on its distinct characteristics (Yao, Li, et al., 2017).
One of the major advantages of geospatial big data is its frequent and timely updates, providing a more up-to-date picture of the analyzed area. Additionally, its granular level of spatial detail enables a deeper understanding of localized patterns and trends. Furthermore, the utilization of geospatial big data is often more cost-effective compared to traditional data collection methods such as surveys or censuses, making it a compelling alternative for supporting data on child poverty (Pokhriyal, Zambrano, Linares, & Hernández, 2020).
By harnessing the power of geospatial big data, stakeholders such as policymakers, researchers, and organizations can gain valuable insights into the spatial dimensions of child poverty. This knowledge can inform targeted interventions, resource allocation, and the evaluation of poverty alleviation programs, ultimately leading to more effective measures in addressing child poverty.
Data Utilized
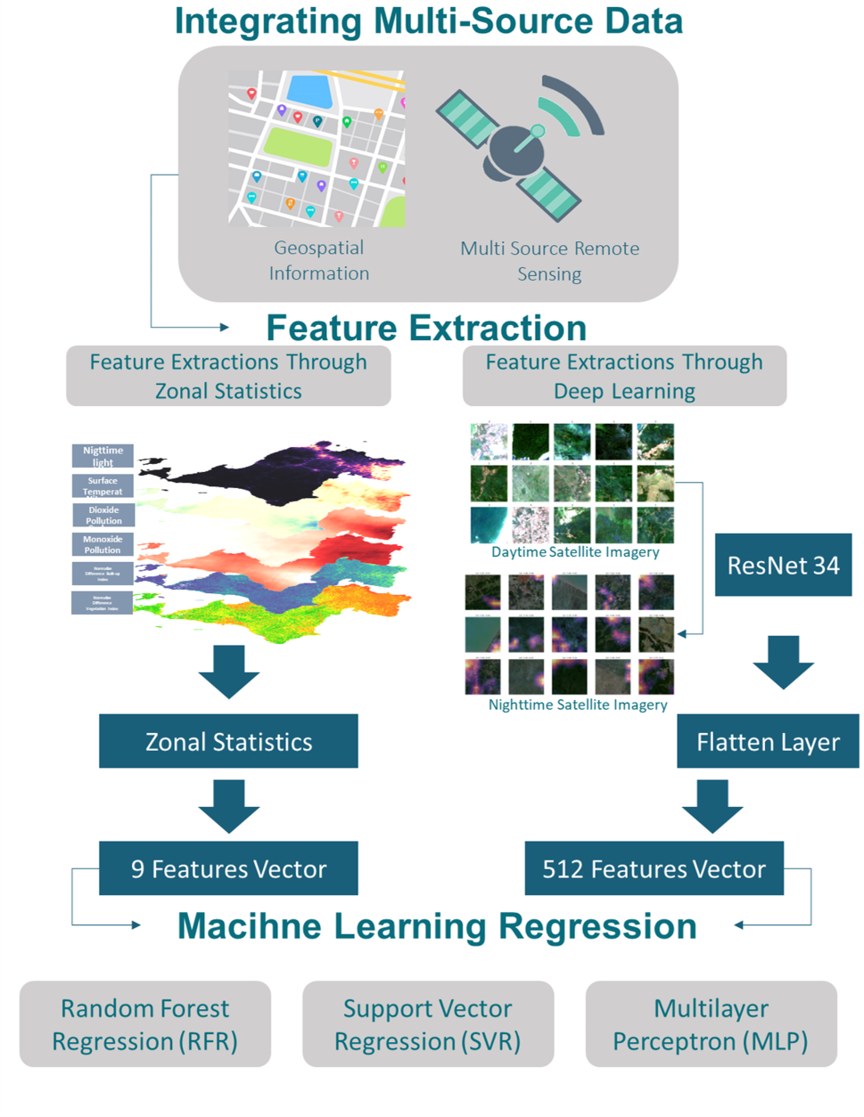
The data used is sourced from geospatial big data, specifically multi-source satellite imagery and other geospatial big data such as Point of Interest (POI) data.
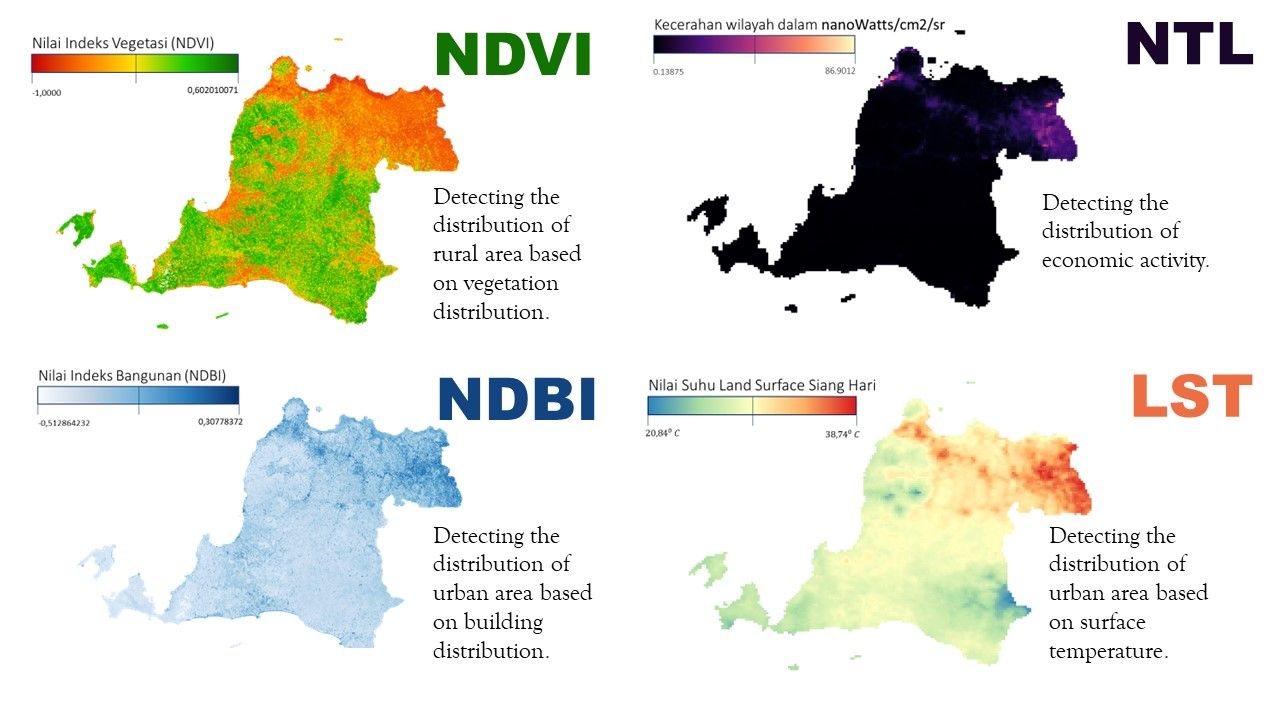
Multi-source satellite imagery involves the integration of data from various satellite sources, providing a comprehensive view of the Earth's surface. These satellite images capture valuable information about land cover, land use, vegetation, and other spatial features. By combining data from multiple sources, it enhances the accuracy and richness of the information extracted.
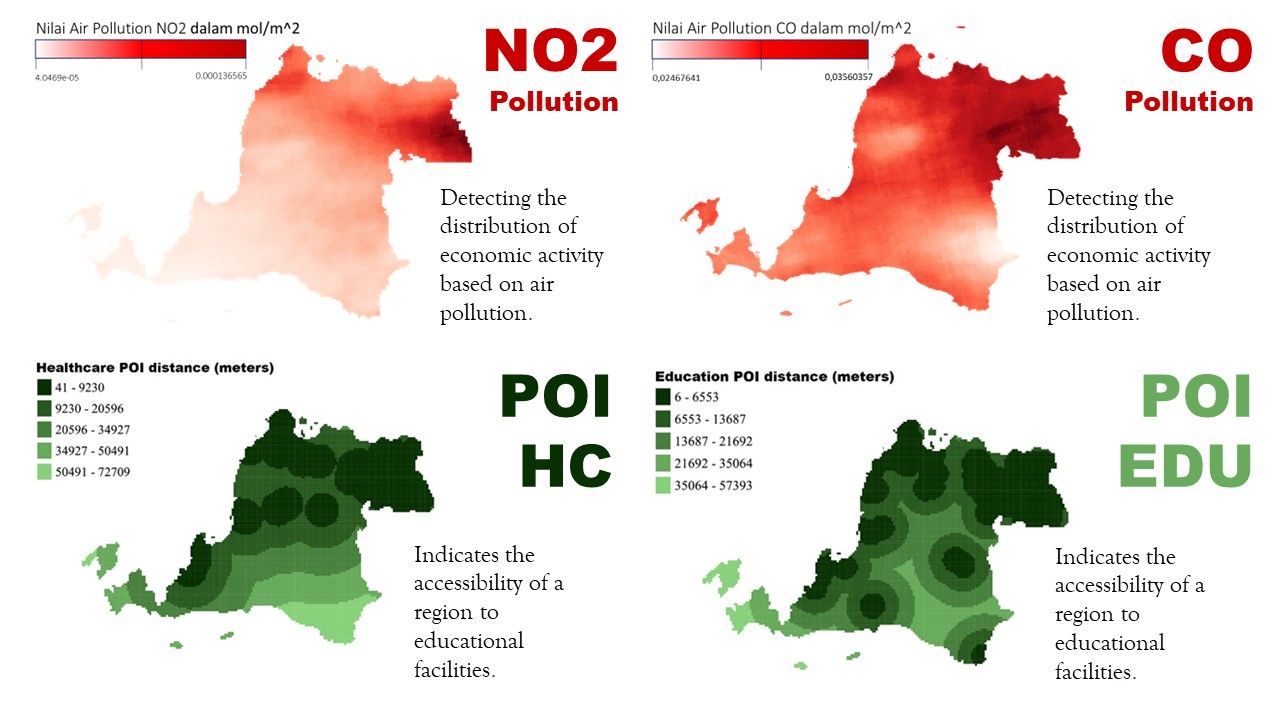
In addition to satellite imagery, Point of Interest (POI) data is another valuable source within geospatial big data. POI data includes information about specific locations such as businesses, schools, healthcare facilities, and other relevant points of interest. It provides insights into the availability and accessibility of essential services for children living in different areas.
By utilizing multi-source satellite imagery and other geospatial big data such as POI data, analysts and researchers can gain a comprehensive understanding of the spatial dimensions of child poverty. These data sources enable the identification of areas with limited access to crucial resources and services, helping policymakers develop targeted interventions and allocate resources effectively.
The integration of geospatial big data enhances the analysis and visualization of child poverty, allowing for a deeper understanding of the spatial distribution and disparities. It provides valuable insights into the physical environment, infrastructure, and socio-economic factors that influence child well-being.
Overall, leveraging multi-source satellite imagery and geospatial big data, including POI data, supports evidence-based decision-making and enables more effective strategies in addressing child poverty by identifying areas in need and directing interventions to where they are most needed.
Methodology
Spatial Granular Estimation for Mapping Child Poverty
Spatial granular estimation plays a crucial role in mapping child poverty, providing a detailed understanding of its distribution and identifying areas with higher concentrations of vulnerable children. By utilizing advanced spatial analysis techniques, it becomes possible to estimate child poverty at a fine-grained level.
In this case study, various data sources are utilized to estimate child poverty levels in Banten Province. These data sources include socioeconomic indicators, demographic information, geospatial datasets, and other relevant data at a local level. By integrating and analyzing these data, spatial modeling techniques can be applied to estimate child poverty across the province.
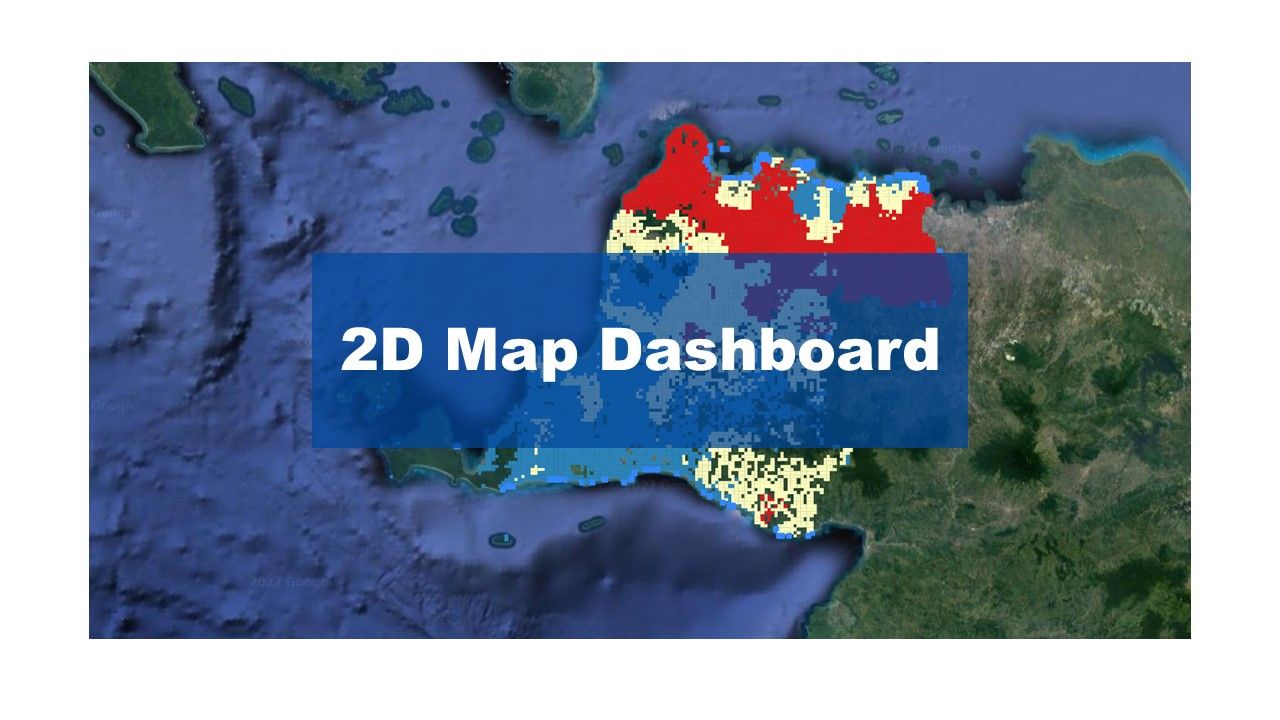
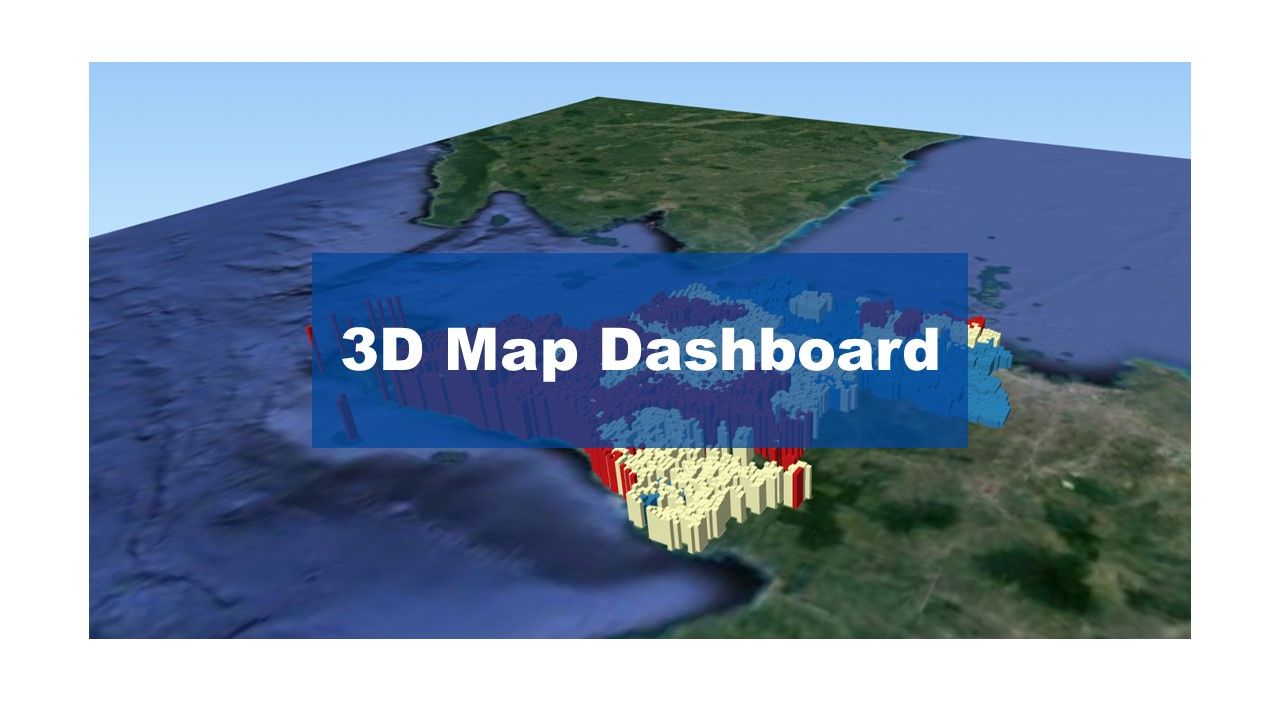
The spatial resolution of a 1-kilometer grid allows for a more detailed and localized estimation of child poverty within Banten Province. It enables the identification of specific areas and communities that are more vulnerable to poverty, facilitating targeted interventions and policy development to address the unique challenges faced by children in those areas.
The output of the estimation process will be spatially explicit data, which can be visualized through maps or other graphical representations. These maps provide valuable insights into the distribution of child poverty across different regions within Banten Province, aiding policymakers and stakeholders in identifying priority areas and implementing effective measures to alleviate child poverty.
By conducting a case study with a 1-kilometer grid resolution in Banten Province, decision-makers can gain a deeper understanding of the localized dynamics of child poverty. This knowledge can guide the development of tailored strategies, programs, and policies to reduce child poverty and improve the well-being of children in the province.
Evaluate Our Work!
For research purposes, users are expected to fill out a user survey regarding their experience using this dashboard.