With satellite imagery and point of interest (POI), poverty can be identified from space!
Poverty as One of SDGs' Main Goals
Considering that poverty is still a problem in many countries, “poverty alleviation” in 2030 will become the “backbone” of the goals of the sustainable development agenda (SDGs).
Poverty which is the main goal of the MDGs is again the main goal in the SDGs. Apart from the fact that poverty and hunger are still global problems, the elimination of poverty as the main goal is directed at ensuring the sustainability of the MDGs achievements.
Poverty is defined as an economic inability to meet basic needs (food, housing, clothing, education, and health) as measured by the expenditure approach (Statistics Indonesia, 2021).
Statistics Indonesia, locally known as Badan Pusat Statistik (BPS), recorded that the number of poor people in Indonesia in September 2021 amounted to around 26.5 million people, with a percentage of the national poor population is 9.71%.
Remote Sensing Satellite Imagery and Point of Interest (POI)
Remote sensing satellite imagery and Point of Interest (POI) have the ability to show human activity from a geographical aspect so that it can be used as an approach to describe poverty (Shi et al, 2020).
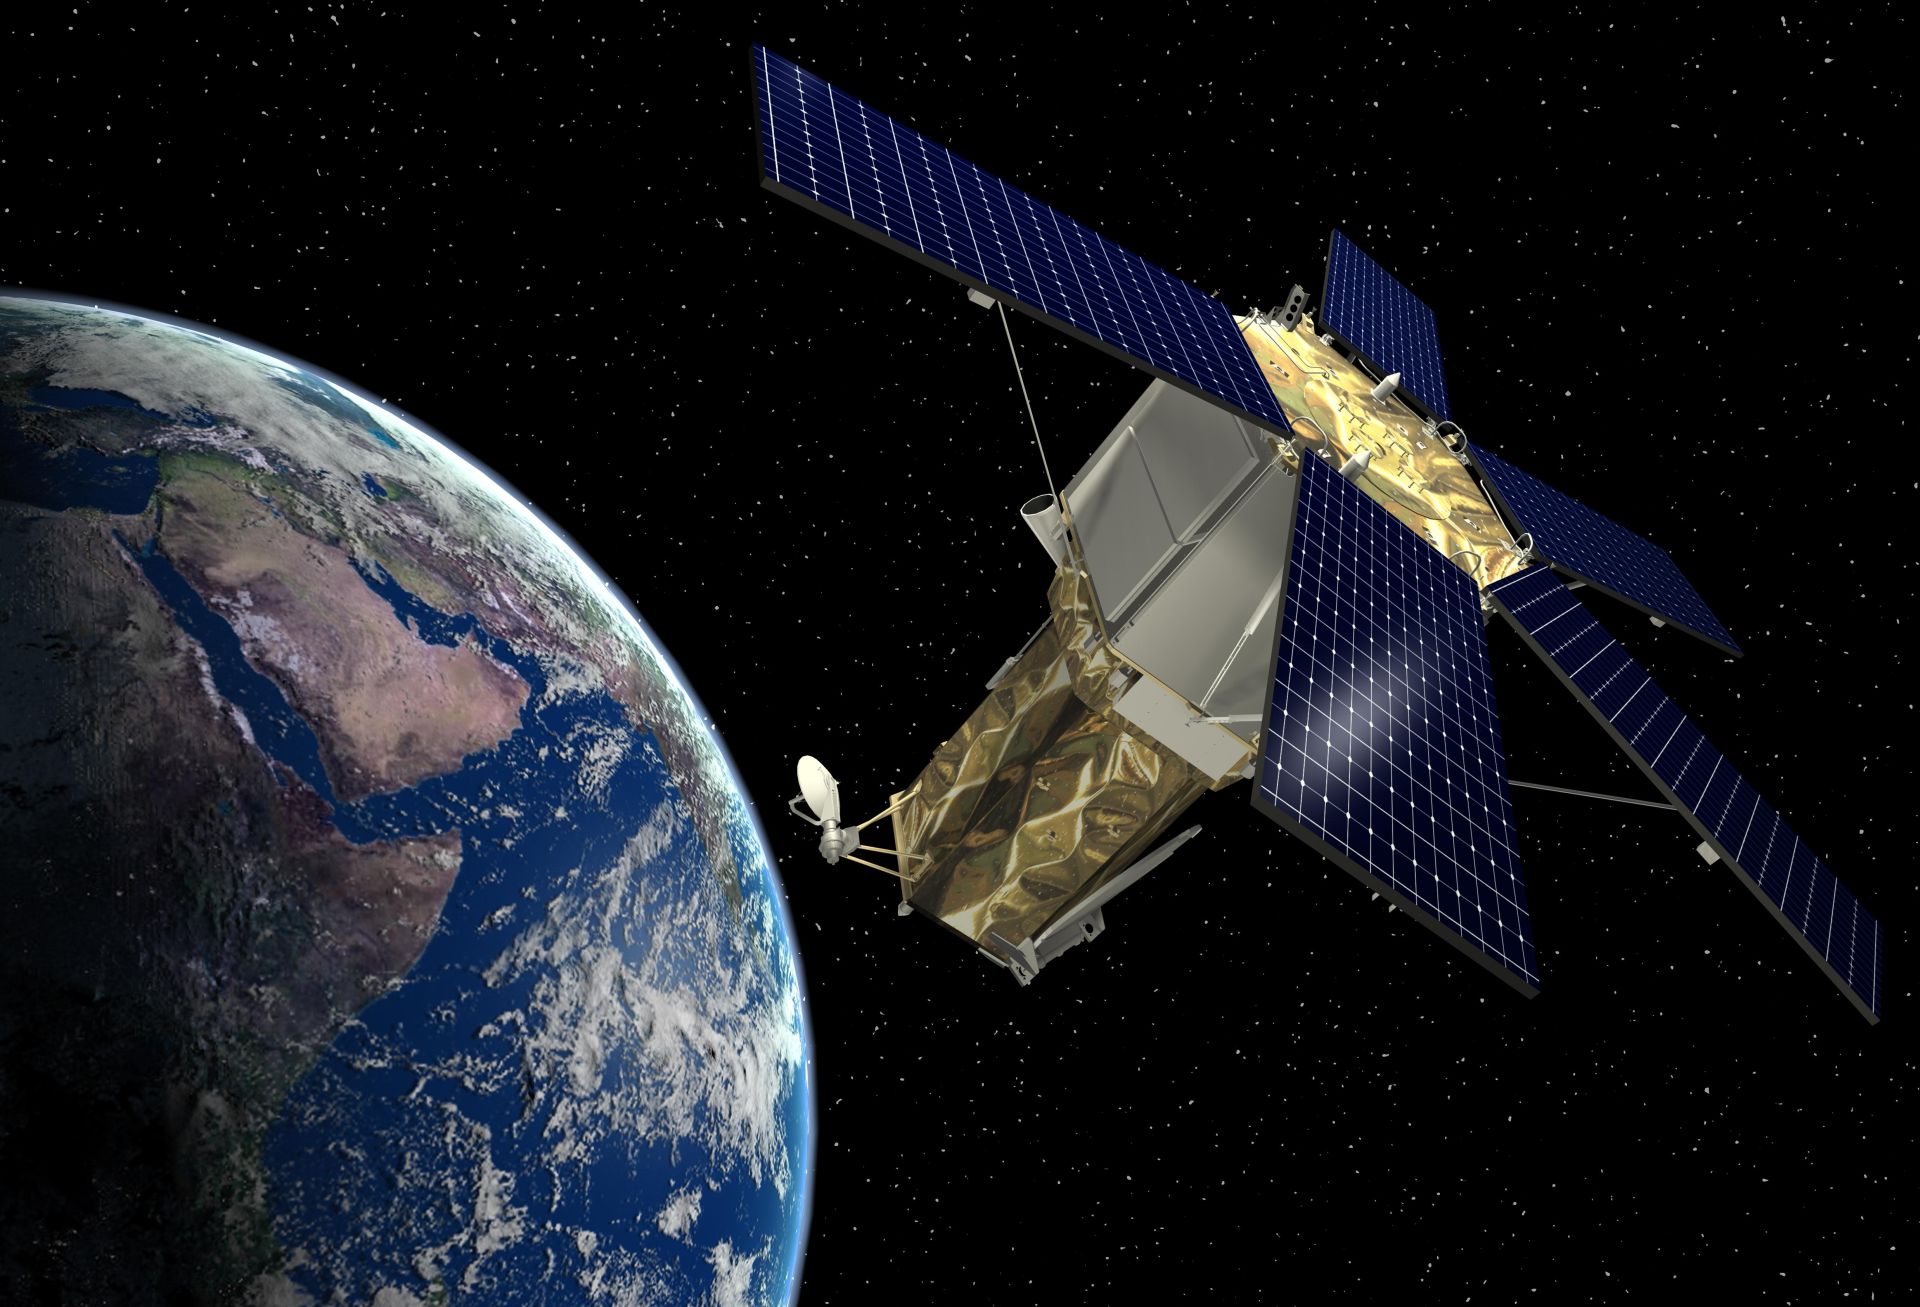
Remote sensing is a method of capturing the characteristics of an area of the earth using remote electromagnetic observations collected through satellite (Campbell & Wynne, 2011).
POI is a geodataset containing information on the location of important points on the earth's surface that can be obtained through OpenStreetMap (OSM) with a very fast update period. This data can provide information related to urban structures and economic facilities (Yao, Li, et al., 2017).
Compared to conventional socio-economic survey data, remote sensing and POI satellite image data is a valuable resource (Triscowati et al., 2020, 2019; Wijayanto et al., 2020) because of its uniqueness and objectivity in viewing the socio-economic and physical phenomena of the environment with multi-scale perspective effectively and accurately (Shi et al., 2020).
Data Used in This Study
The data used are multisource satellite imagery from remote sensing and POI from OpenStreetMap!
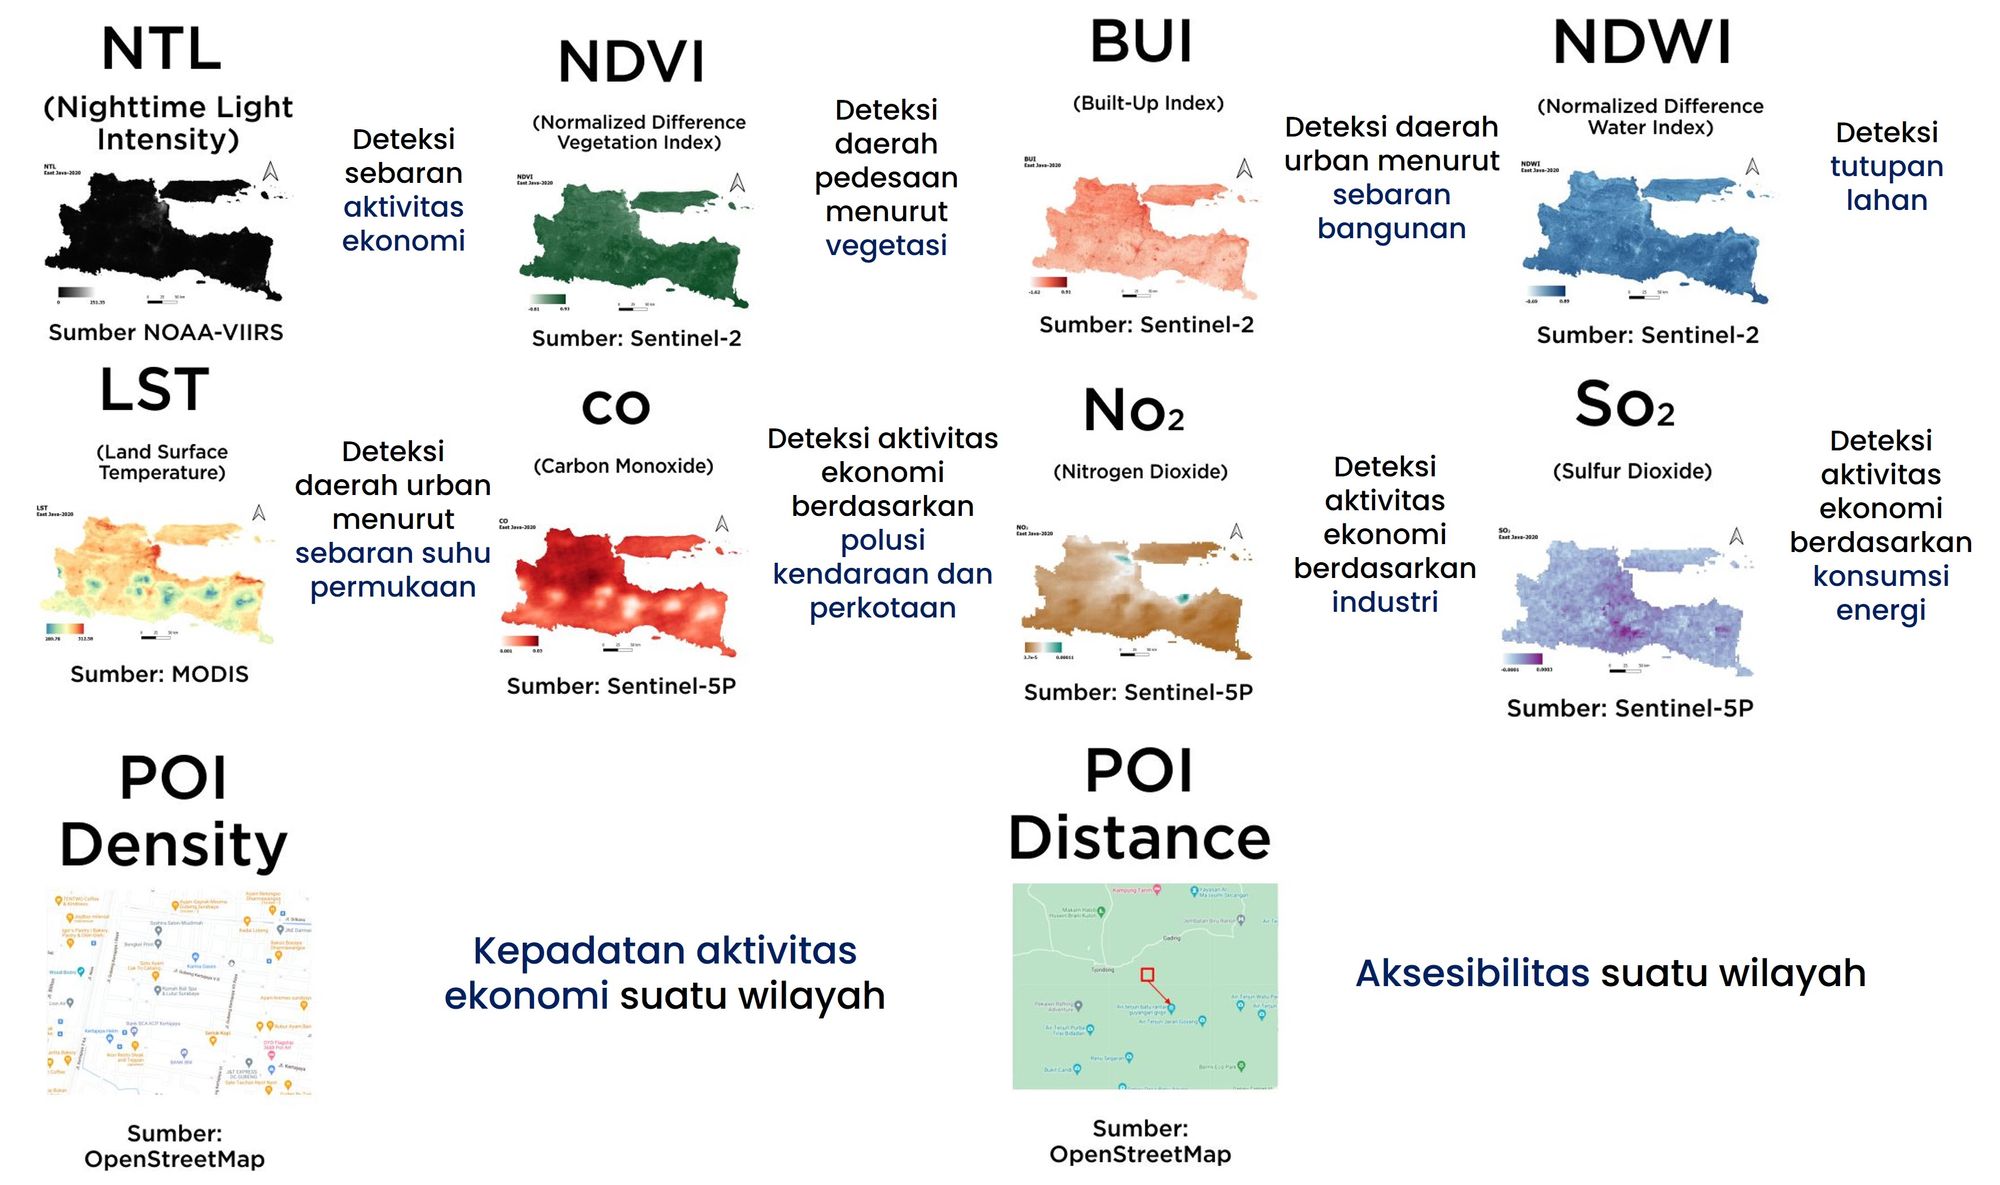
- NTL (Nighttime Light Intensity) to detect the distribution of economic activity at night
- Normalized Difference Vegetation Index (NDVI) to detect rural areas by vegetation
- Built-Up Index (BUI) to detect urban areas by building distribution
- Normalized Difference Water Index (NDWI) for land cover detection
- Land Surface Temperature (LST) for urban areas detection, according to the distribution of the land surface temperature
- Carbon Monoxide (CO) for economic activity detection based on vehicle and urban pollution
- Nitrogen Dioxide (NO2) for economic activity detection based on industry
- Sulfur Dioxide (SO2) for economic activity detection based on energy consumption
- POI Density to show the density of economic activity of a region
- POI Distance to show the accessibility of a region
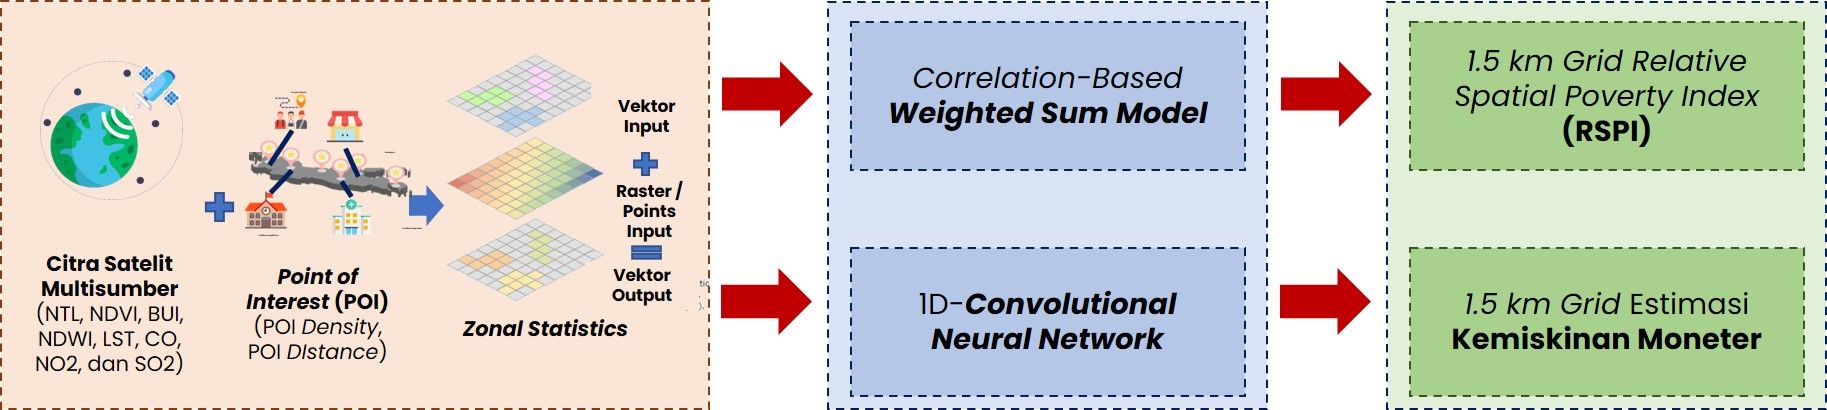
Grid Level 1.5 km Poverty Mapping
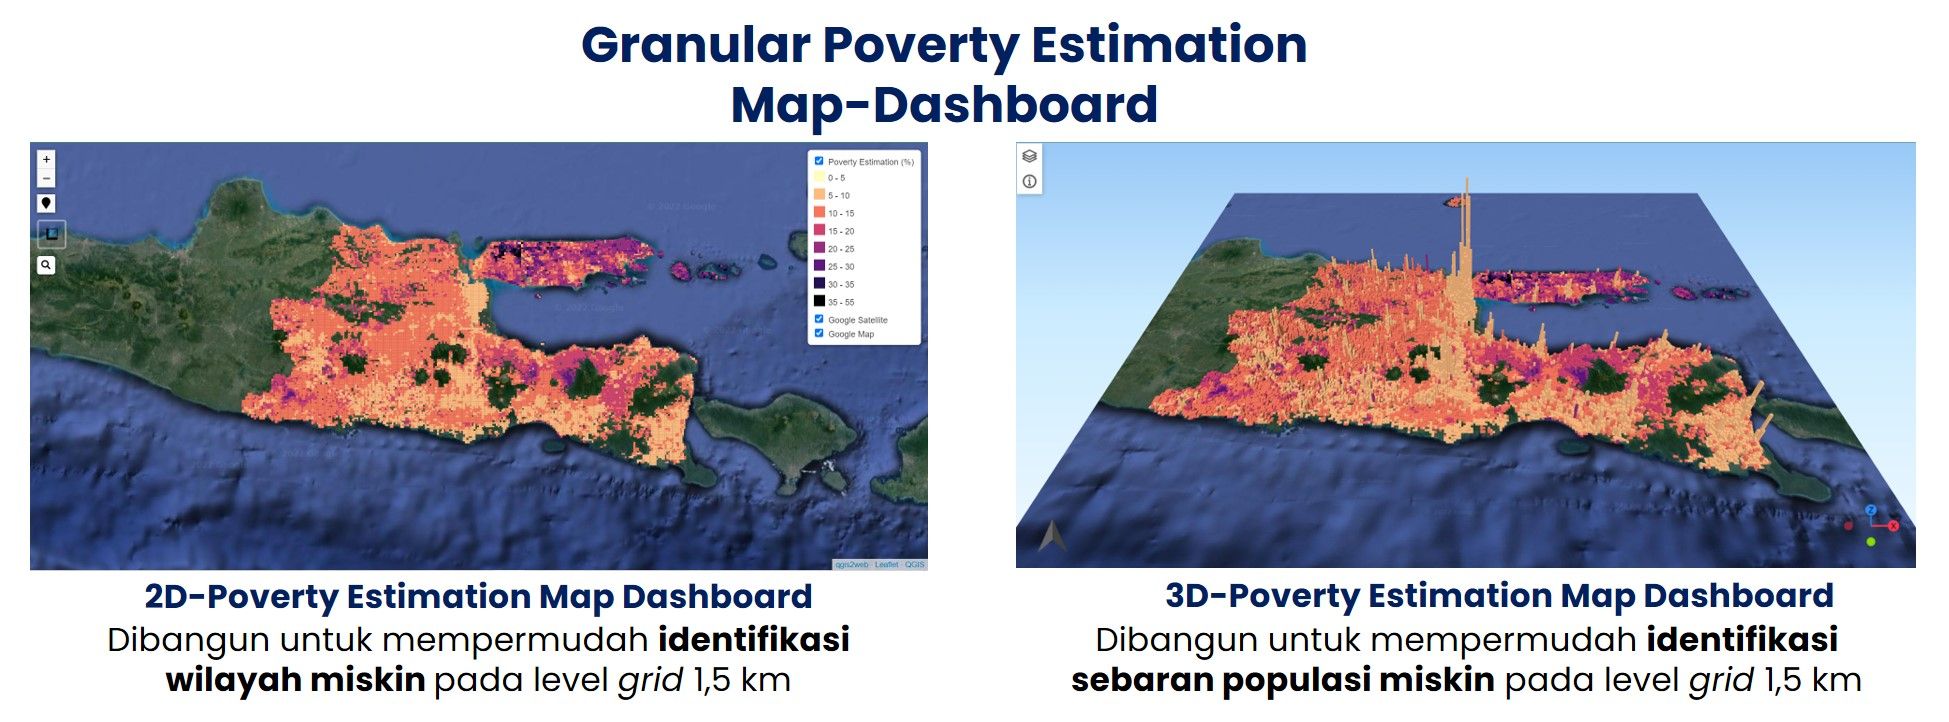
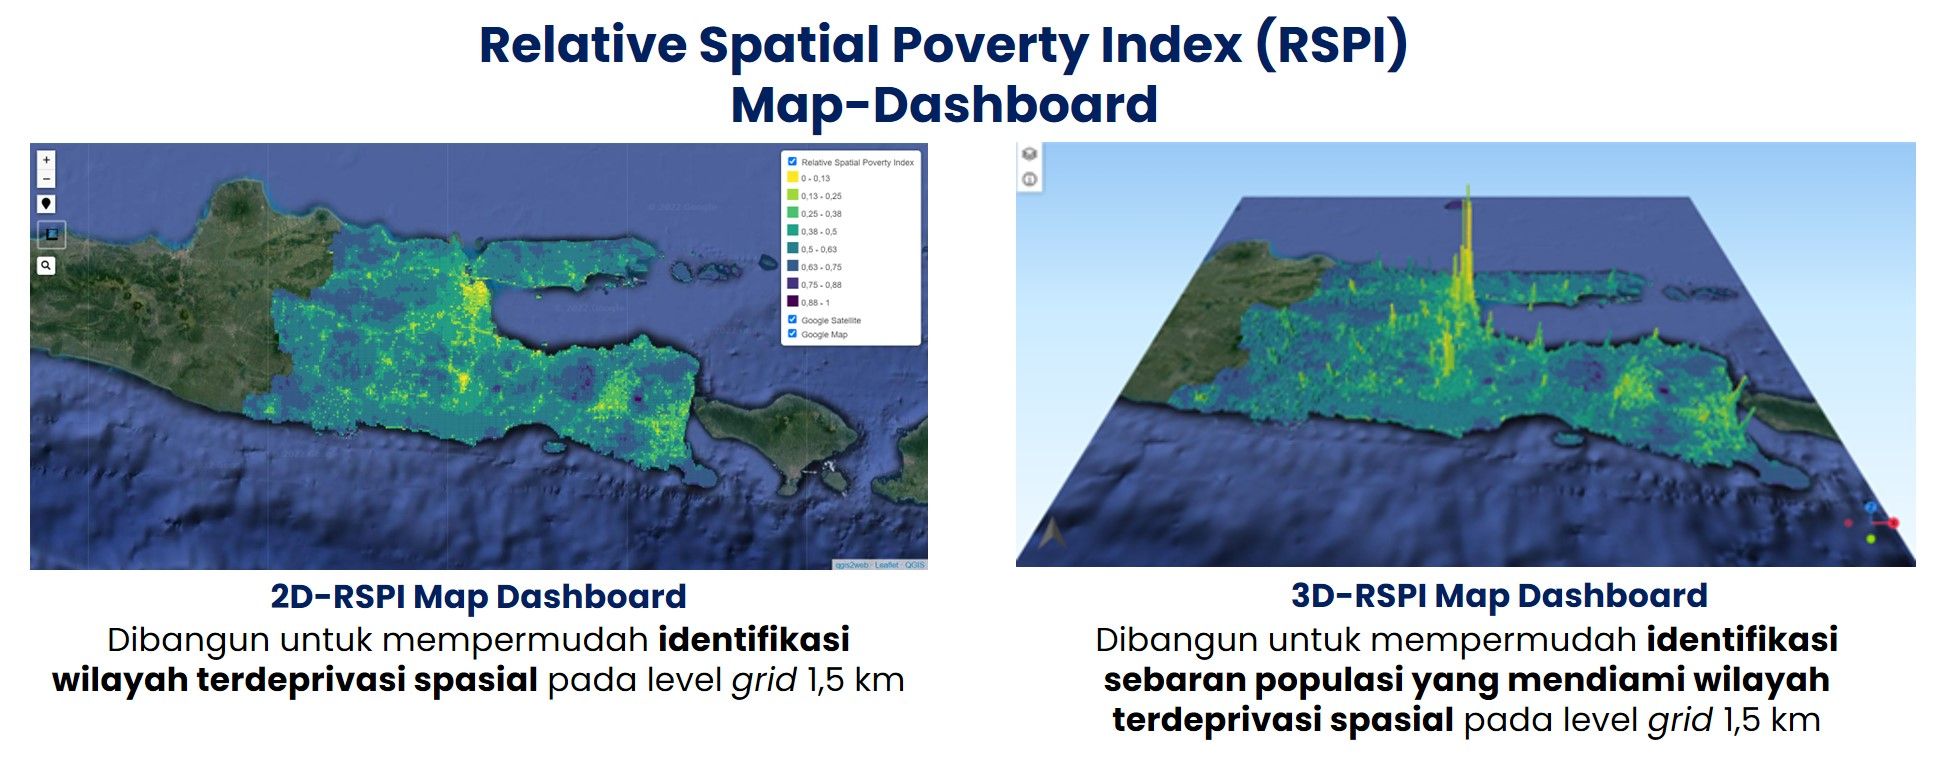
From multi-source satellite imagery and POI, monetary poverty estimation map was built using a deep learning model, and relative spatial poverty (RSPI) map was built using a weighted sum model as illustrated below.
Map Dashboard
The results obtained are then presented on an interactive dashboard map.
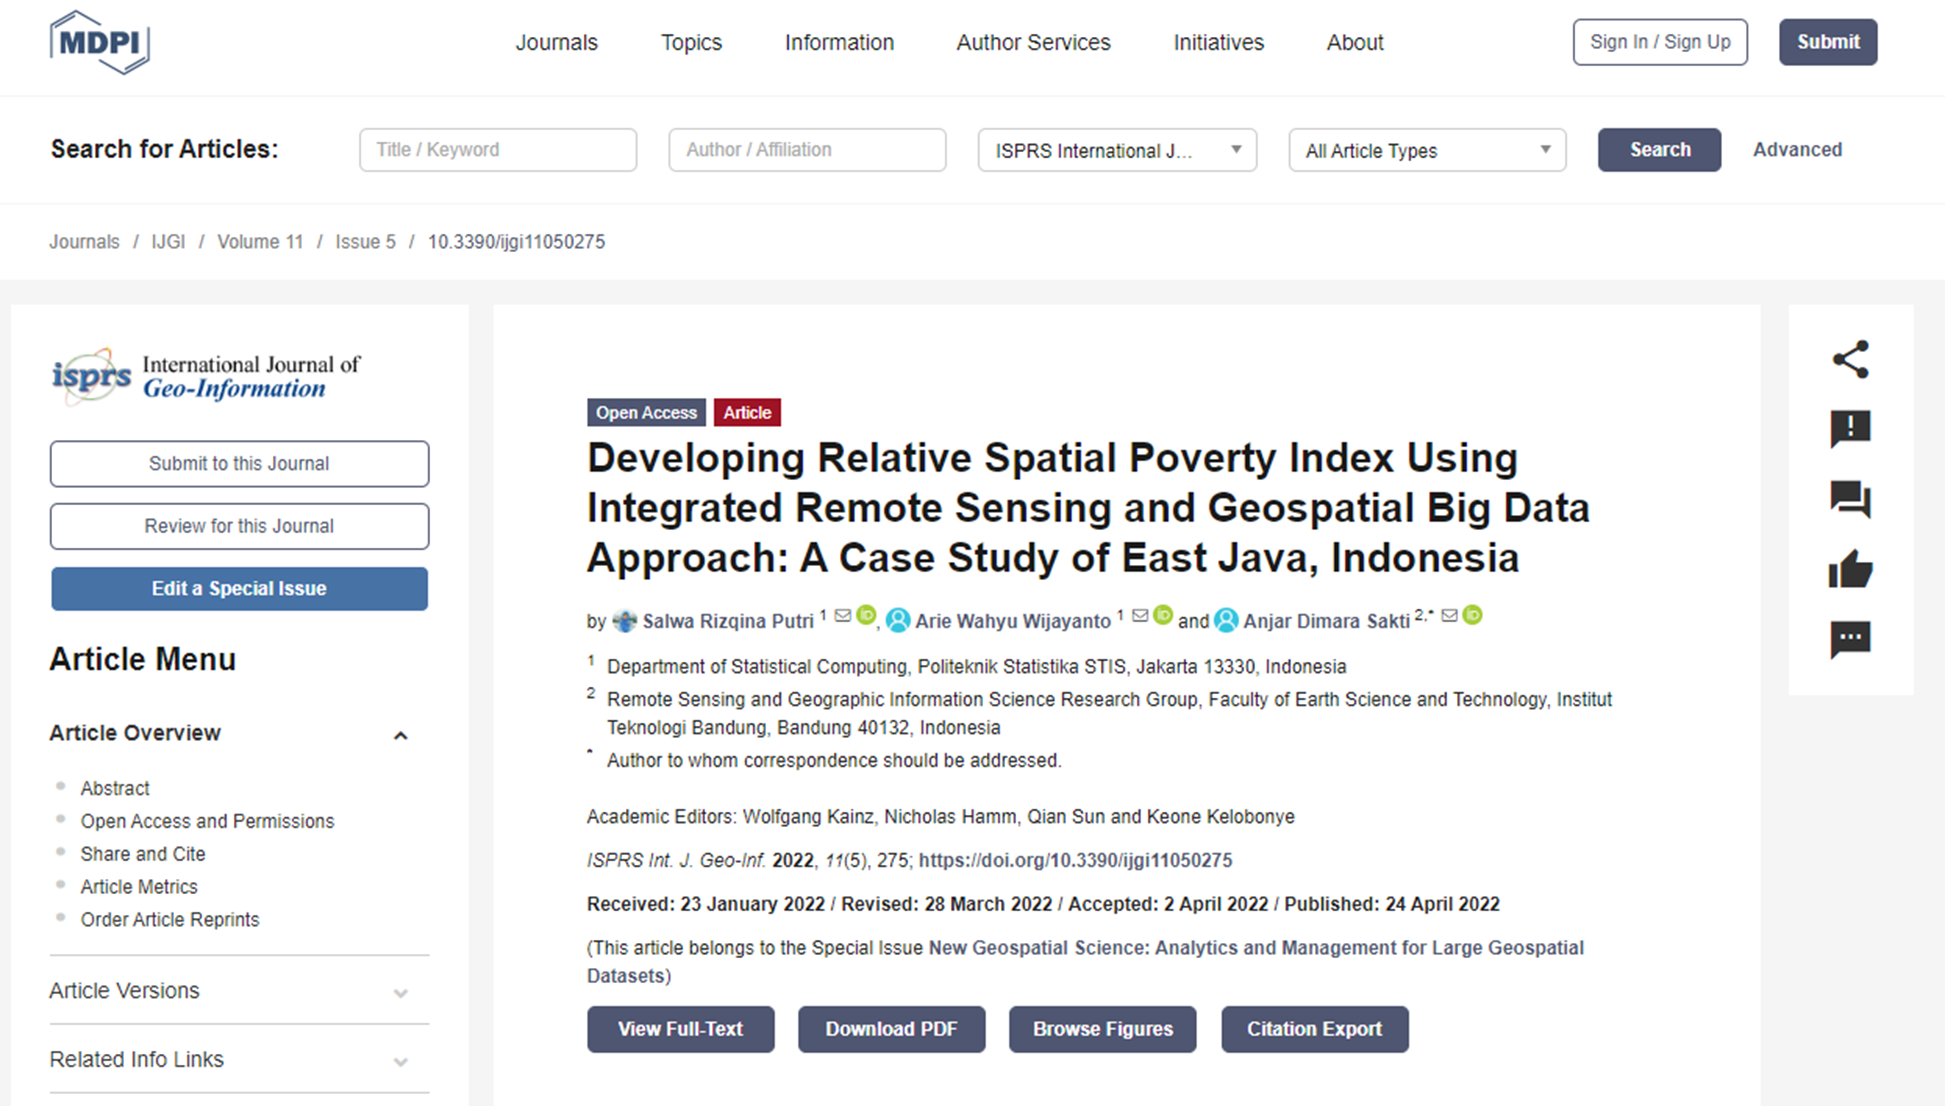
Publication
Research results have been published on: https://www.mdpi.com/2220-9964/11/5/275
Evaluate Our Work!
For research purposes, users are expected to provide an evaluation of their experience using this dashboard map.