
Tuberculosis: The Leading Cause of Respiratory Disease Death by Infectious Agents Worldwide
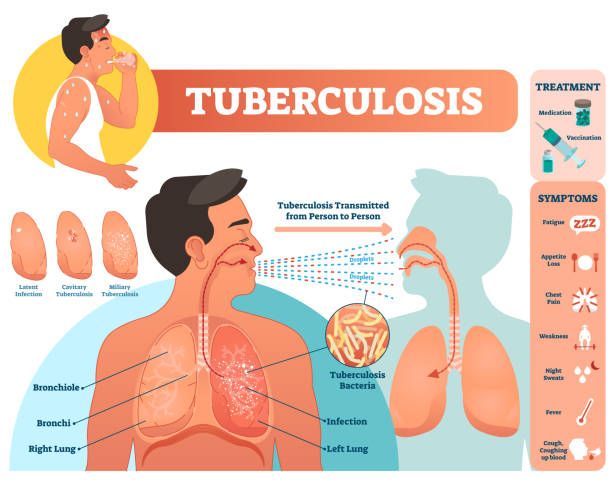
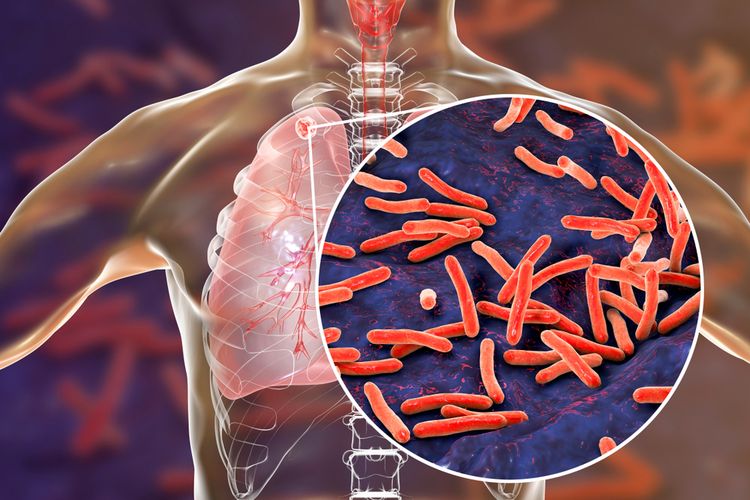
Tuberculosis (TBC) is the primary cause of respiratory disease mortality caused by infectious organisms worldwide, and it continues to provide a serious problem in public health. (WHO, 2021). TBC is caused by Mycobacterium tuberculosis, a harmful bacterium transferred through the air when an infected person coughs, sneezes, or speaks (WHO, 2021). However, in some cases, these bacteria can also spread to other organs such as the kidneys, bones, or brain through the bloodstream, causing a disease called extrapulmonary tuberculosis (CDC, 2020). This situation exacerbates the overall public health burden and hampers global efforts aimed at controlling and eradicating the disease.
The rapid and widespread spread of tuberculosis highlights the significance of a comprehensive and integrated strategy to its management. Prevention, early detection, effective treatment, and public education about the hazards and transmission of tuberculosis are crucial. Detailed, accurate, and thorough data-driven approaches are critical for monitoring illness development, evaluating intervention success, and making sound judgments about health-care program implementation. Consistent research and worldwide collaboration are also required to produce new, more effective TB treatments.
Tuberculosis is a disease that affects not just individuals but also the economy and society. People with tuberculosis often have lower work productivity, higher medical treatment costs, and social stigma, which can lead to social isolation. In countries with high TBC rates, such as Indonesia and India, the impact is more acute, affecting millions of families and communities. As a result, TB control initiatives must engage various sectors, including governments, health institutions, communities, and the commercial sector, to foster patient recovery and prevent the disease from spreading further.
Given that tuberculosis is still the primary cause of respiratory death caused by infectious organisms worldwide, increased attention and commitment from all parties is urgently required. Strong health policies, proper financial support, and innovation in medical research and technology must all be created and implemented to lessen the disease's burden. Such collaborative and sustained actions can combat the disease while also greatly improving the quality of life in global communities.
Tuberculosis Prevalence Conditions in Indonesia
The Data from the Ministry of Health (2021) in Indonesia show that, with 969,000 cases, Indonesia has the second-highest number of tuberculosis cases worldwide, behind India. Additionally, the Indonesian Ministry of Health projected that in 2022, there would be 52 cases of tuberculosis deaths for every 100,000 people (Ministry of Health, 2023). As a result, tuberculosis (TB) is a serious health problem that needs to be addressed seriously by everyone. Then, West Java and East Java provinces are the areas with the greatest number of cases.
Only district-or city-level aggregate data on tuberculosis cases in Indonesia is available, and it is updated annually by the Ministry of Health; hence, it lacks the specific details required for a more thorough examination. This restriction might result from things like traditional surveillance-based data reporting and collection techniques, which require a lot of money, time, and labor. Because of the disease's rapid spread, data processing and verification are crucial, as is specialized knowledge (Ministry of Health, RI, 2017).
However, as part of the National Medium-Term Development Plan (RPJMN) 2020–2024, the National Tuberculosis Control Strategy in Indonesia for the period 2020–2024 sets goals to lower the incidence of tuberculosis to 65 cases per 100,000 people by 2030 and the mortality rate from tuberculosis to 37 cases per 100,000 people by 2024 and 6 cases per 100,000 people by 2030 (Ministry of Health, RI, 2020).
In order to achieve this goal, a different method of presenting tuberculosis susceptibility risk data is required in order to enable the monitoring and assessment of complete health development planning. Additionally, more rapid updates and more detailed data presentation are required.
Our Innovation: Combination of Multisource Geospatial Big Data and Machine Learning Algorithm
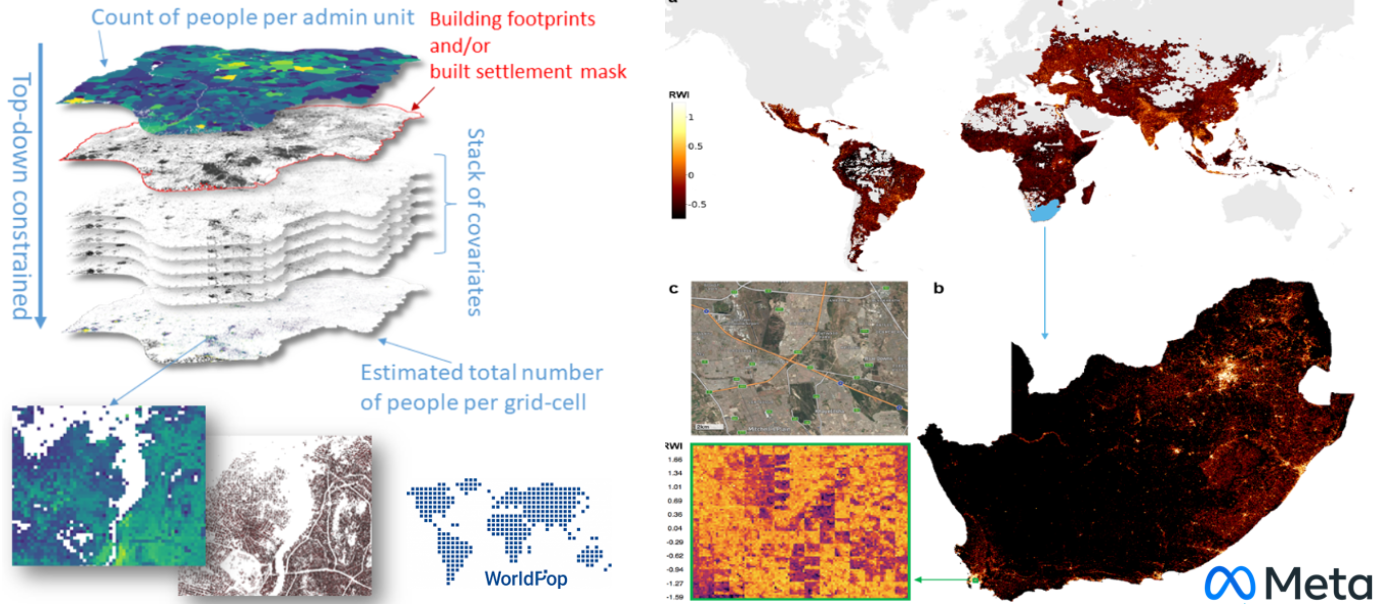
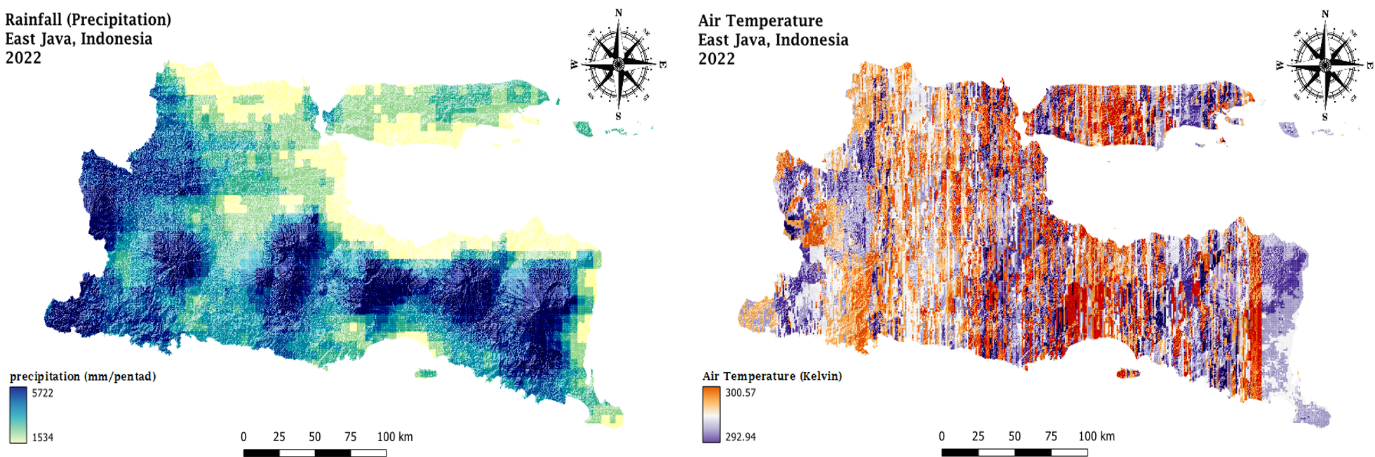
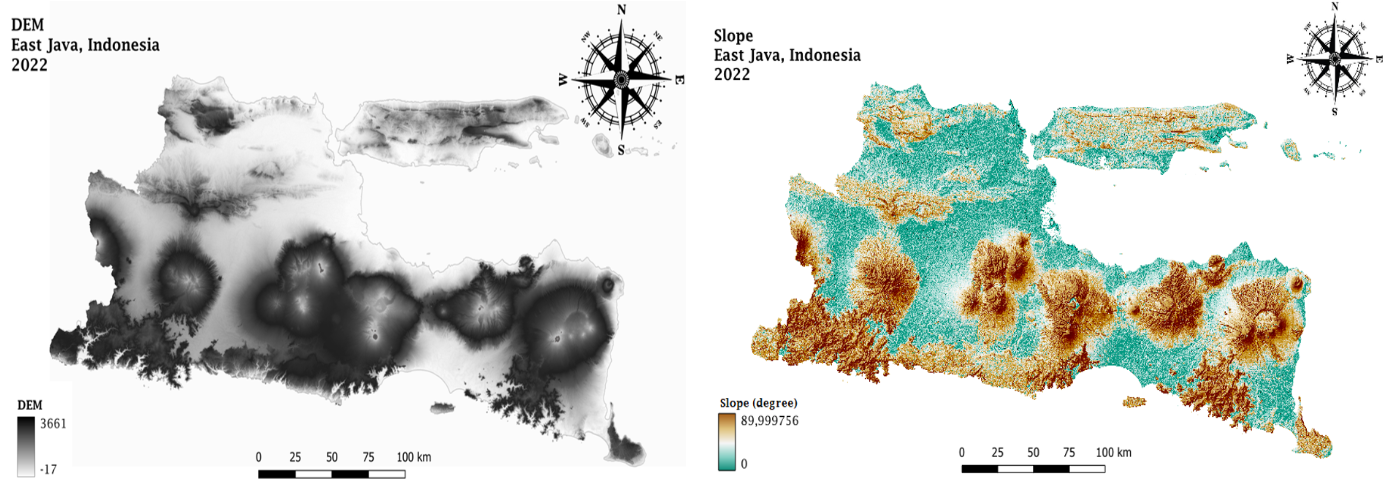
The application of geospatial big data, encompassing remote sensing satellite imagery and points of interest (POIs), offers a transformative approach to overcome the limitations of official tuberculosis (TBC) data. Remote sensing involves acquiring information about the Earth's surface using electromagnetic radiation emitted from devices not in direct physical contact with the terrain (Statistics Indonesia-Badan Pusat Statistik, 2022). This technology encompasses a range of products derived from satellite sensors such as Suomi-NPP VIIRS, Sentinel 2 Multi Spectral Instrument (MSI) Level 2A, Sentinel-5 Precursor, Terra-MODIS, and NASA SRTM.
Moreover, points of interest (POIs) are geospatial datasets that include location-specific data about the surface of the Earth (Liu & Xiong, 2013). These datasets are derived from OpenStreetMap and other similar open-source platforms. The Meta Facebook Relative Wealth Index (Chi et al., 2022) is a noteworthy geospatial dataset that provides extensive coverage of wealth distribution data. Then, the Gridded Population from WorldPop provide detailed demographic data. The utilization of these data collection techniques yields several benefits, such as improved population characteristic insights, efficient and objective monitoring of socio-economic and physical phenomena, cost effective, and a more comprehensive representation of geographic areas (Putri et al., 2022; Ramadhan & Wijayanto, 2023; Utami et al., 2023).These geospatial datasets can be used to create precise maps that show the risk of tuberculosis susceptibility with the integration of machine learning techniques.
The Data and Variables Used
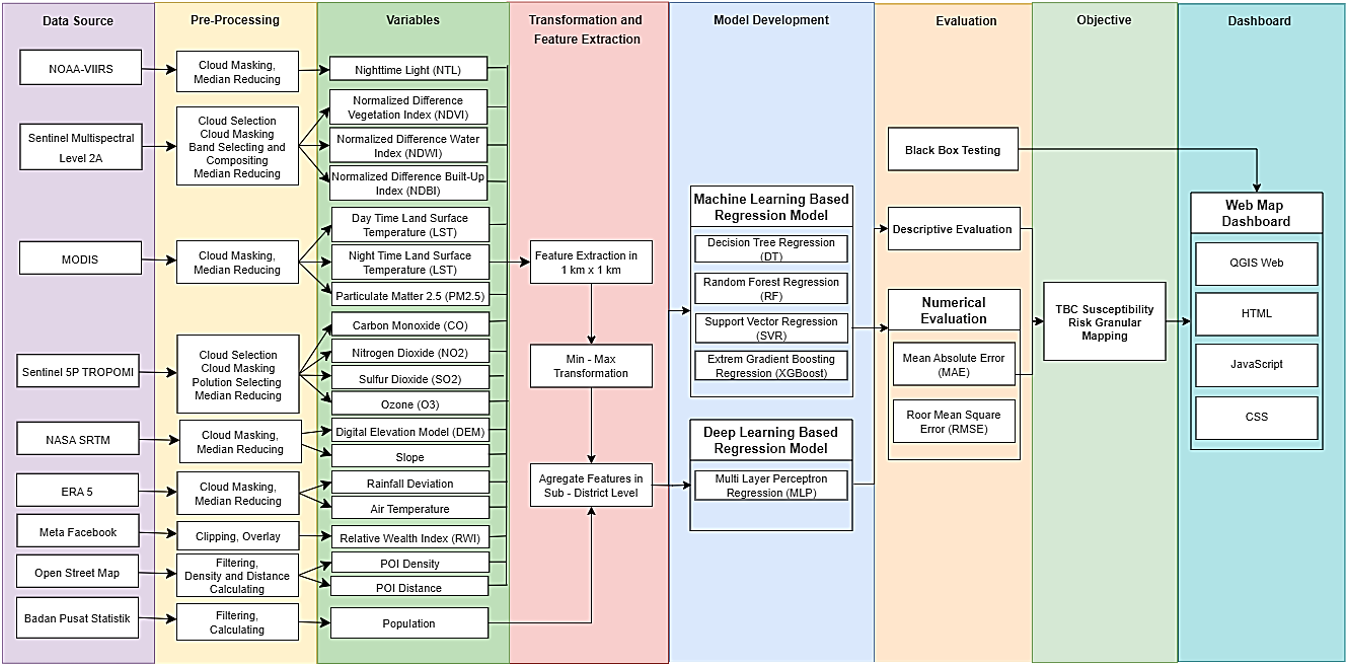
The data used in this research came from a variety of geospatial big data sources, including satellite images, Points of Interest (POIs), and other geospatial datasets. Satellite imagery data were acquired between January 1, 2022, and December 31, 2022, with a focus on East Java Province. The POI data was obtained from OpenStreetMap, while the Relative Wealth Index from Meta Facebook provided the other geospatial data.
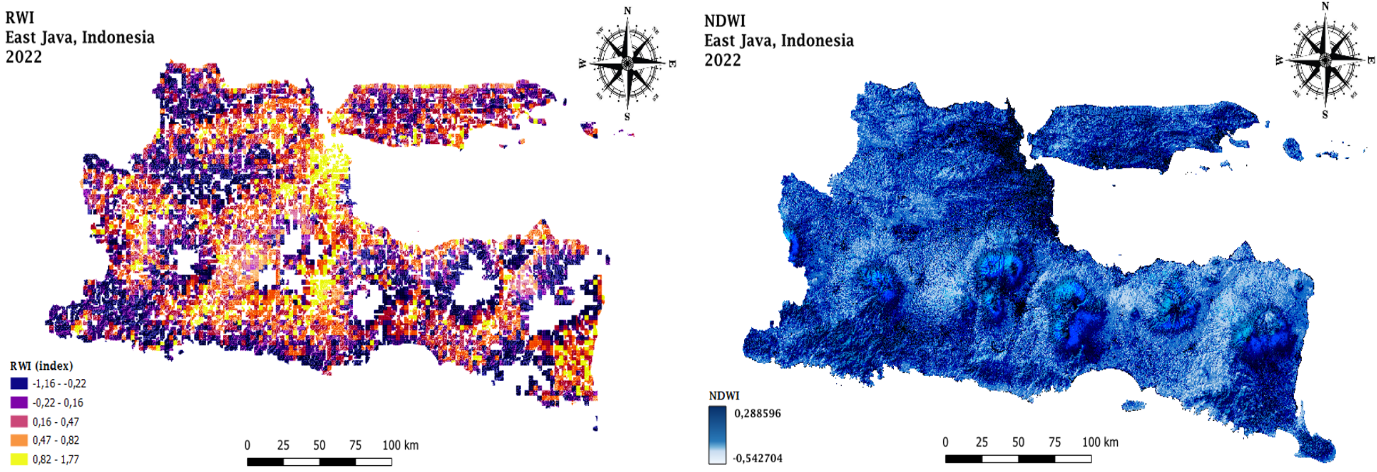
The POI data, which totaled over 17,000 points, was divided into three categories: health, education, and economic facilities. The number of these amenities within each 1-kilometer resolution area was then counted to demonstrate infrastructural density. Furthermore, the distance from the center of each 1-kilometer resolution region to the nearest facility was determined using Euclidean distance to demonstrate accessibility. The Relative Wealth Index (RWI) is another geospatial big data source used to assess the local population's well-being. Statistics Indonesia (Badan Pusat Statistik, BPS) provided official total population statistics, while BPS collected TB prevalence data through the Indonesian Ministry of Finance. To estimate tuberculosis prevalence, the data were classified into several categories.
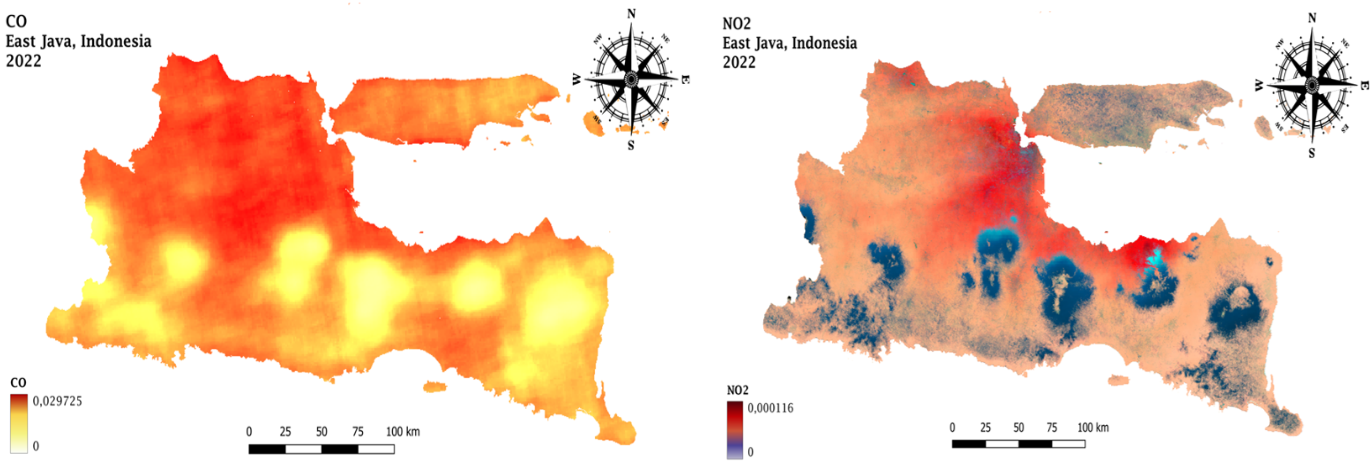
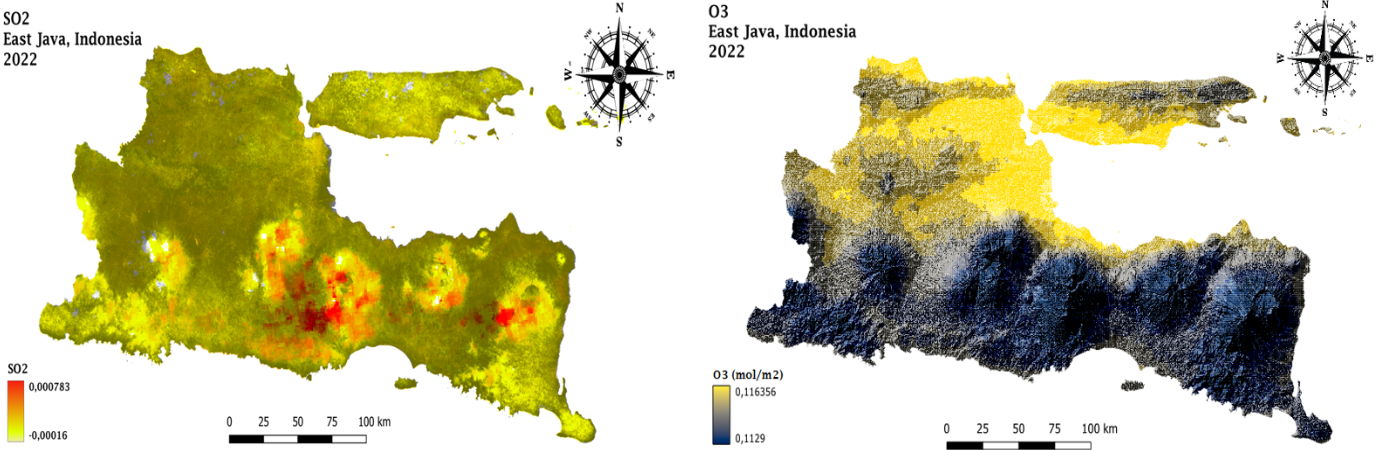
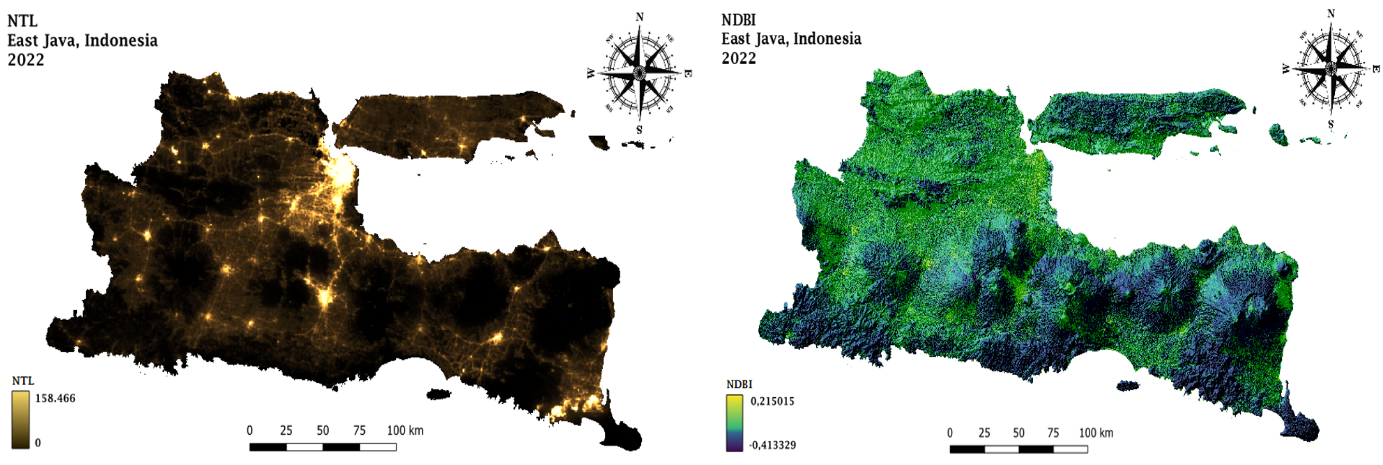
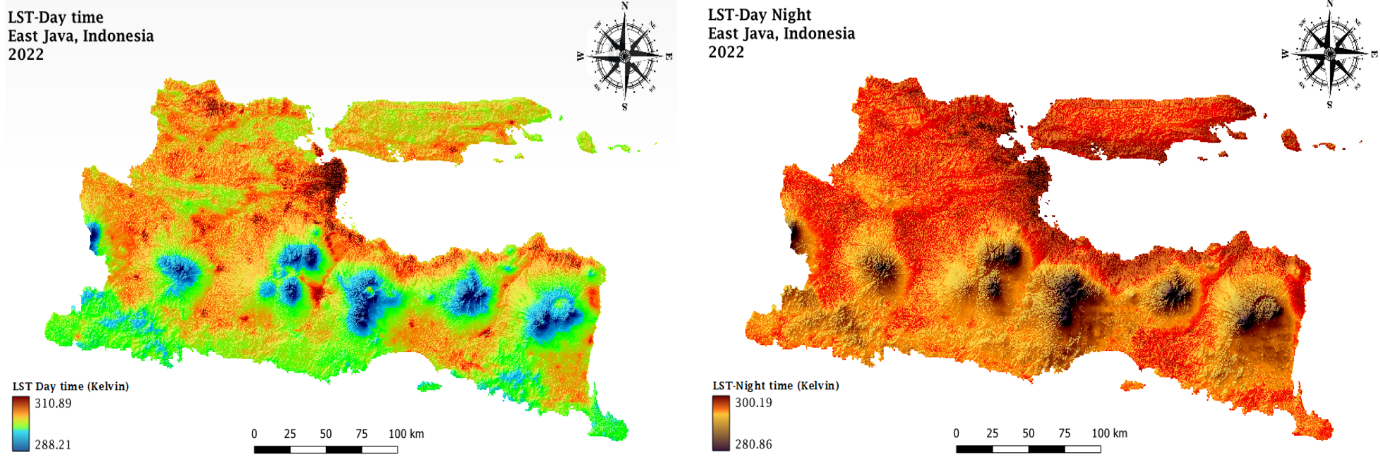
Air quality, green open space, population density, infrastructural density and accessibility, regional well-being, physical environment, and regional topography are among the aspects considered. Here is a visualization mapping a general overview of the aspect approach used using the multisource geospatial big data that has been described.


Our Methodology Proposed
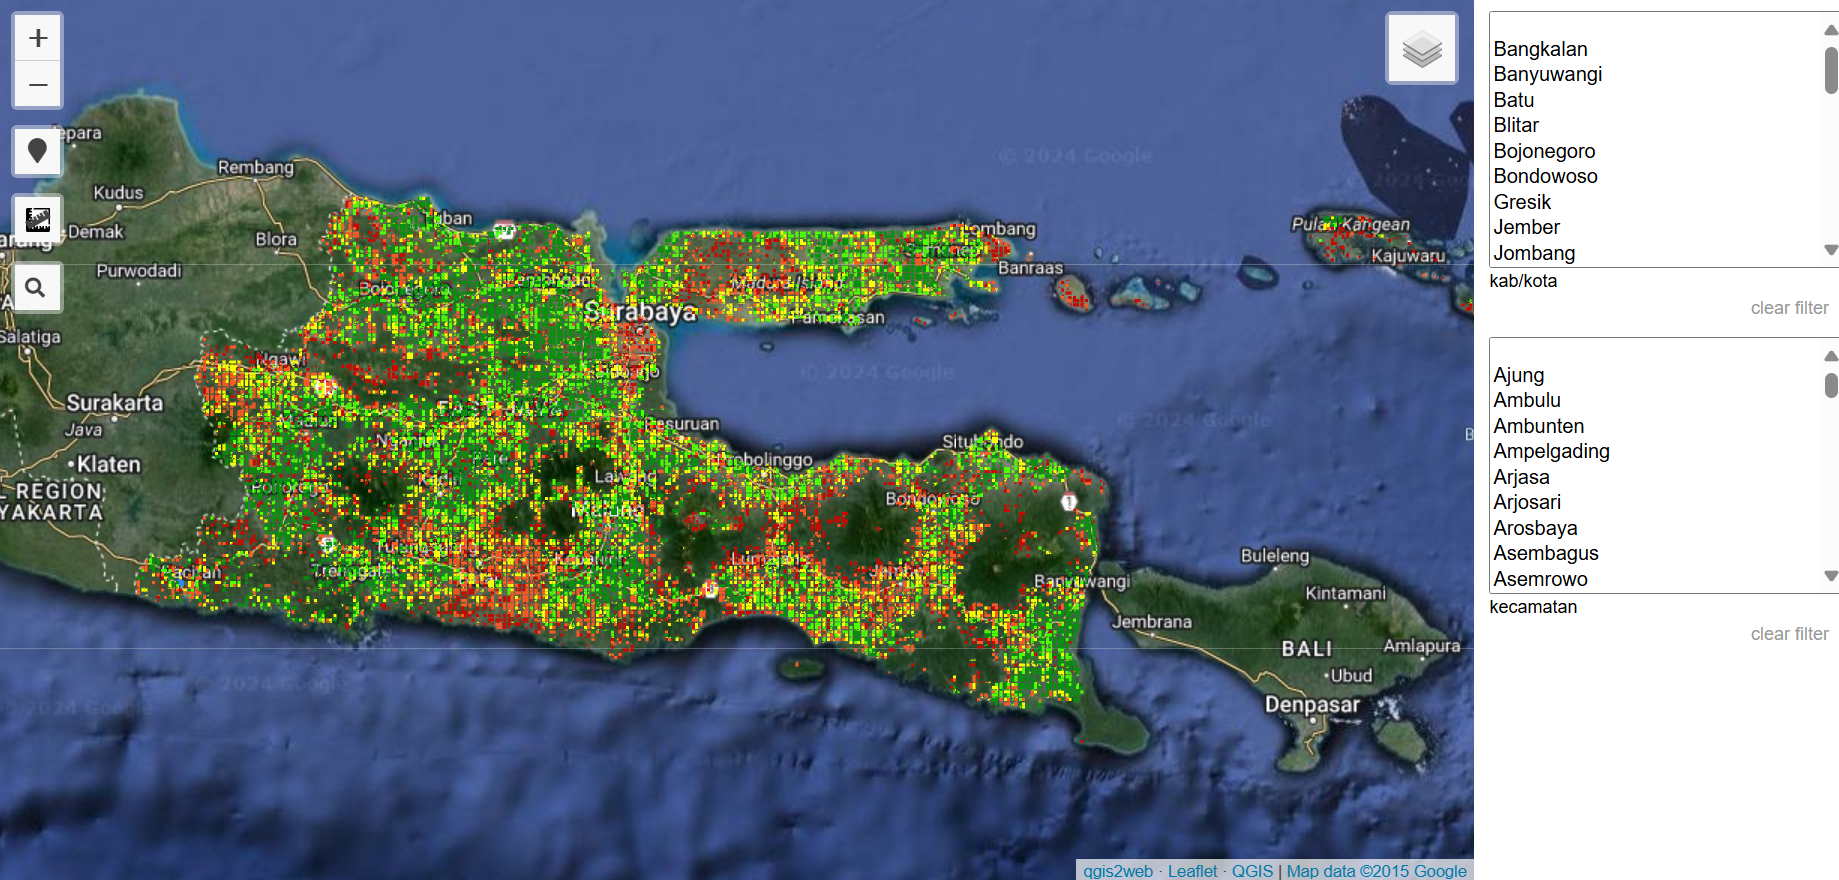
The feature extraction results of those multisource geospatial big data features that have been feature engineered will become independent variables in each machine learning and deep learning algorithm. The final result is Tuberculosis Susceptibility Risk Area Estimation mapping at the best granularity level of 1 km x 1 km spatial resolution in East Java, Indonesia. The Web Map Development Dashboard is then created to make it easier for users, particularly associated stakeholders, to access research data and make better decisions and policies about health development.
A Granular Mapping of the Tuberculosis Susceptibility Risk Area with 1-Kilometer Resolution
A spatial granular estimate is essential for both identifying places with larger concentrations of deprivation and providing a through grasp of the risk distribution in order to map tuberculosis susceptibility risk areas efficiently. The use of sophisticated spatial analytic methods enables a more accurate and thorough evaluation of TB susceptibility.
Using multisource geospastial big data, this case study estimates tuberculosis (TBC) susceptibility levels in East Java. The physical environment, geographical topography, population density, infrastructural accessibility and density, air quality, and green open spaces are a few of these aspects. Artificial Intelligence (AI) techniques like machine learning and deep learning can be used to combine and analyze this data to estimate TB susceptibility at a granular level throughout the province.
The geographical resolution of a 1-kilometer area inside East Java Province enables a more accurate and focused estimation of tuberculosis susceptibility risk. With this degree of specificity, it is possible to identify communities and regions that are more likely to become infected, which makes it easier to build interventions and policies that are specifically designed to address the problems these populations experience in developing their health. The estimate process produces spatially explicit data, which is displayed through maps or other graphical representations. These maps offer important insights on how the risk of tuberculosis susceptibility varies throughout East Java Province's various regions. Stakeholders and legislators can use this information to pinpoint problem areas and put practical solutions in place to alleviate disparities in health and development.
Decision-makers can learn more about the localized dynamics of TBC susceptibility risk in East Java Province by carrying out a case study with a 1-kilometer area resolution. The development of customized initiatives, plans, and policies targeted at lowering inequality of health development and enhancing the wellbeing of the local populace can be guided by the information provided.
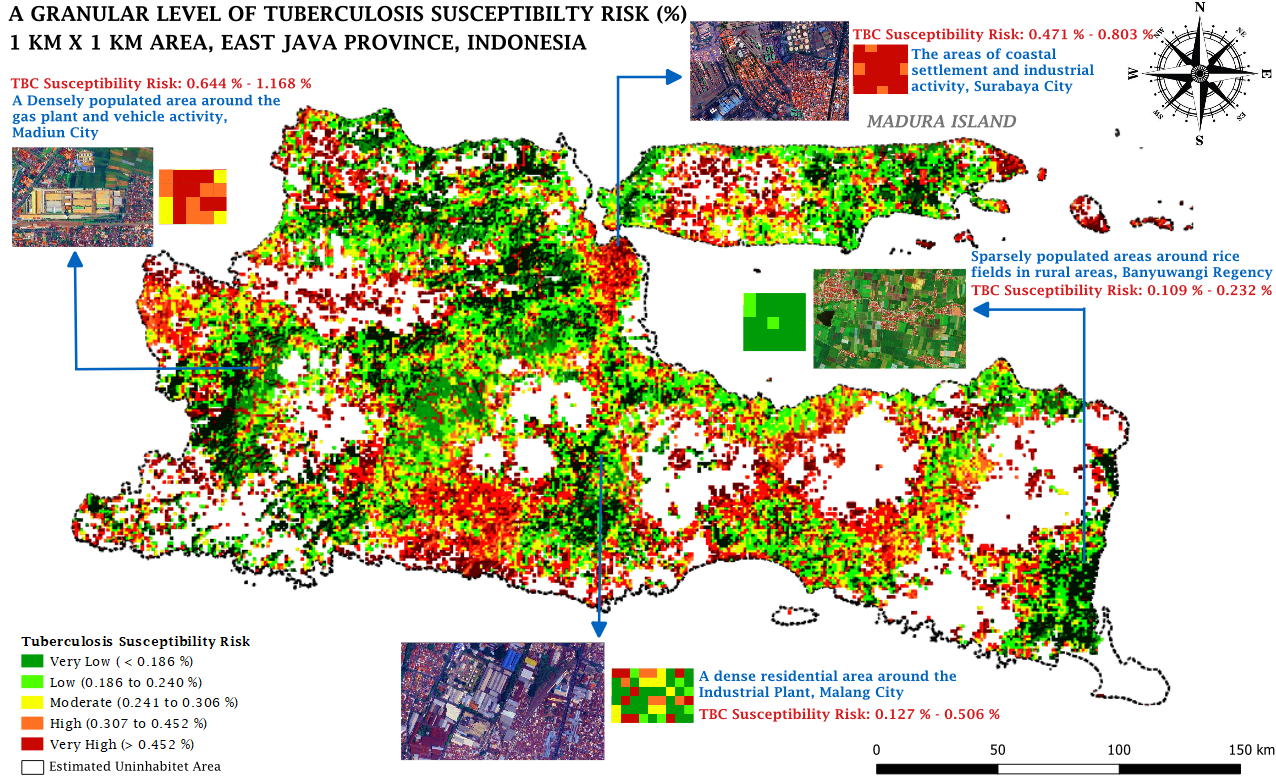
Our machine learning algorithm-developed mapping results demonstrate a very strong correlation: 74.9% of the official tuberculosis prevalence statistics at the regency/municipality level can be explained by a granular mapping of tuberculosis susceptibility risk. This highlights the advantages of using multisource geospatial big data and machine learning methods together, as we suggest, to enhance policymaking by supplying high-quality data as alternative data to support the official data.
One benefit of the 2-dimensional web map dashboards that we deploy is that they allow users—especially stakeholders—to identify precise locations inside each 1-kilometer area. The map dashboard created in this study includes a number of extra elements that improve stakeholders' and users' capacity to recognize tuberculosis susceptibility risk estimates and related indicators in a more precise, user-friendly, and interactive manner.
VISIT 2D MAP DASHBOARD HERE!
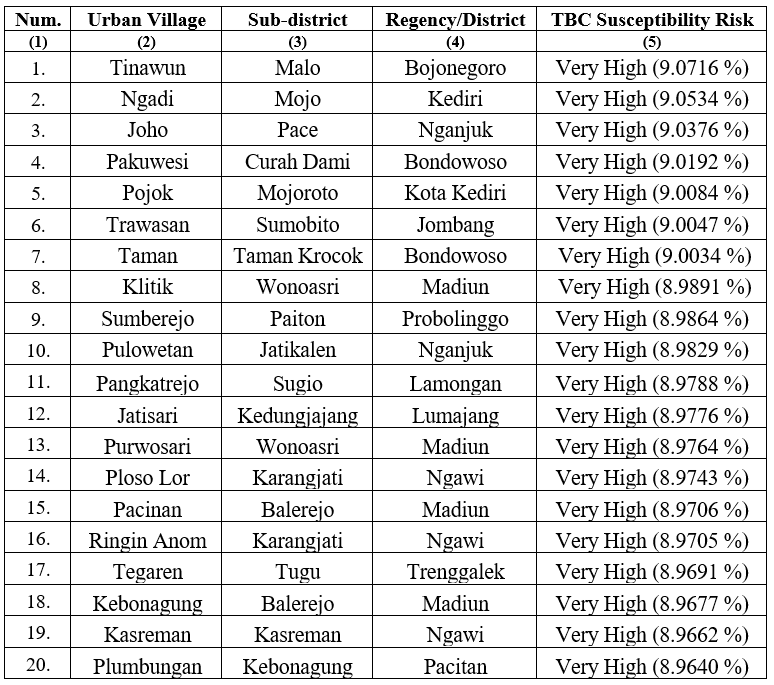
Health Development Priority Area for Preventing Tuberculosis Disease
Health development policies prioritize areas based on the granular mapping estimation of tuberculosis susceptibility risk at the finest 1 km x 1 km resolution. Using the distribution of the General Allocation Fund (DAU), this study illustrates the advantages of utilizing comprehensive geographic big data to coordinate development policy direction at the lowest administrative levels, such as sub-village or village. A web-based map dashboard designed specifically for this purpose facilitates policy review. Stakeholders are assisted in identifying priority development areas for policy execution by the map dashboard, which aggregates data from the village to the sub-district level of tuberculosis susceptibility risk mapping.
Please Provide Us With Your Advice and Feedback for Our Evaluation, Here!